Schedules
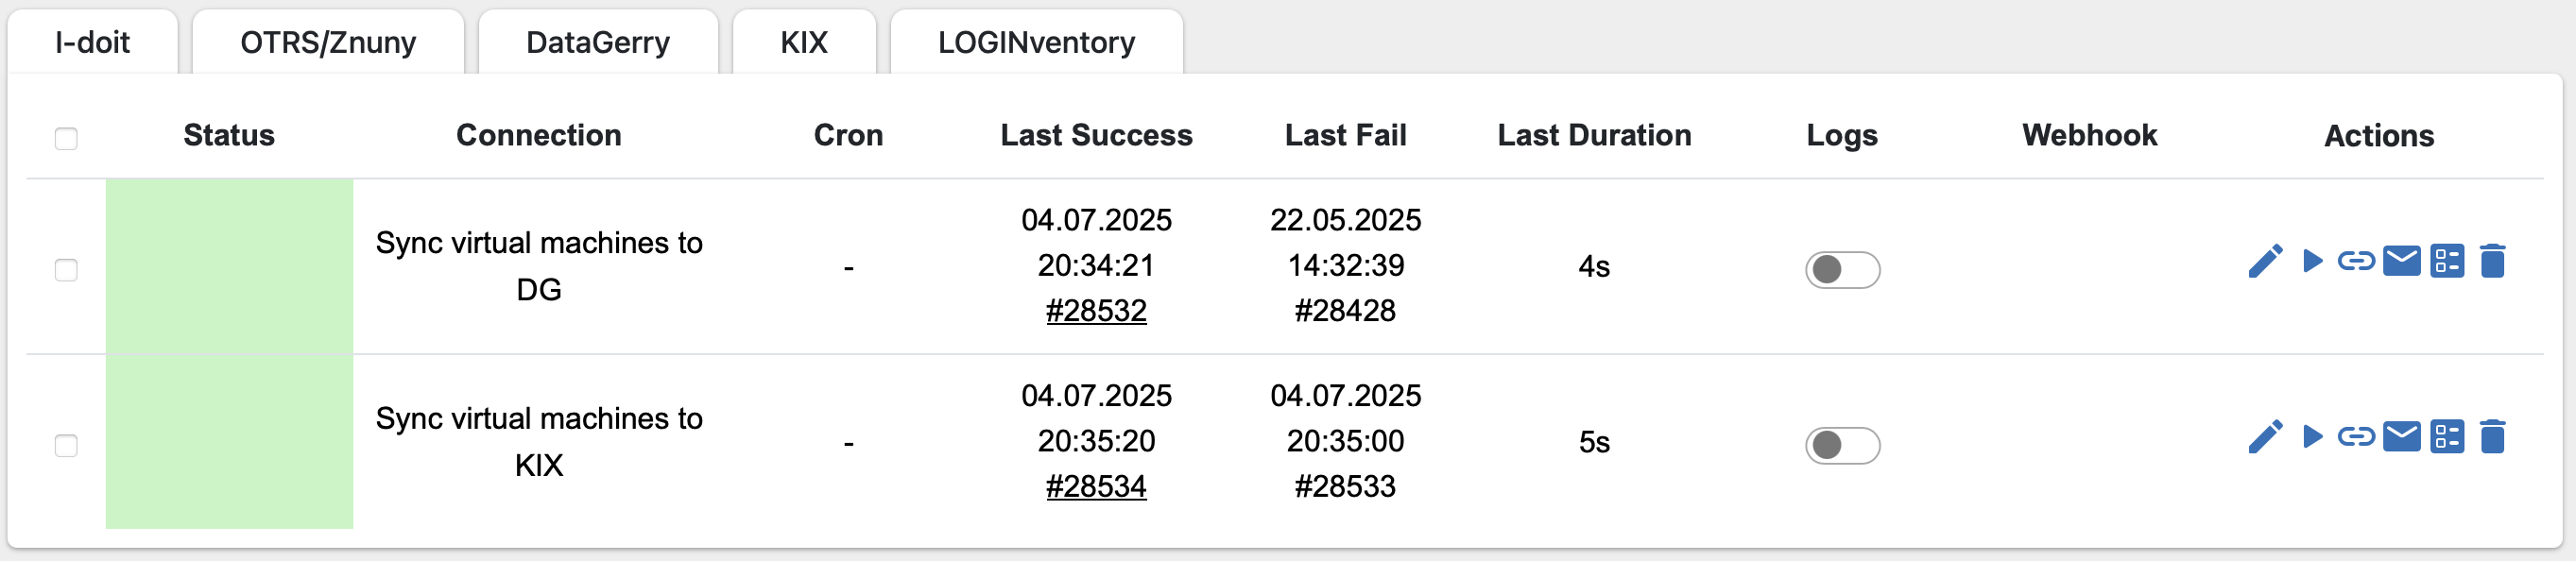
The Schedules panel shows an overview of all schedules that have been set up. In general, a schedule defines which connection should be performed when. All CRUD actions are one one page. The list view shows the following information for each connection:
- Status
grey: connections without Cron-job
green: last run was successful
red: last run was unsuccessful
Name of the connection
Cron expression
Date and time of the last successful run of the connection
Date and time of the last unsuccessful run of the connection
Duration of the last successful run
Switch for activating/deactivating the logs
Webhook
Above the list you can see the categories. These are categories defined on the connection page. You cannot modify them here. All displayed schedules can be filtered by the corresponded connection category.
The logs could be enabled/disabled directly here clicking on the toggle button.
If the schedule contains webhook, it could be copied clicking on the icon:  .
The url is stored in the clipboard. Now you can paste it where you need.
.
The url is stored in the clipboard. Now you can paste it where you need.
The Action column has six additional icons:
![]() - edit
- edit
![]() - start job (immediately)
- start job (immediately)
![]() - webhook
- webhook
![]() - notifications
- notifications
![]() - logs
- logs
![]() - delete
- delete
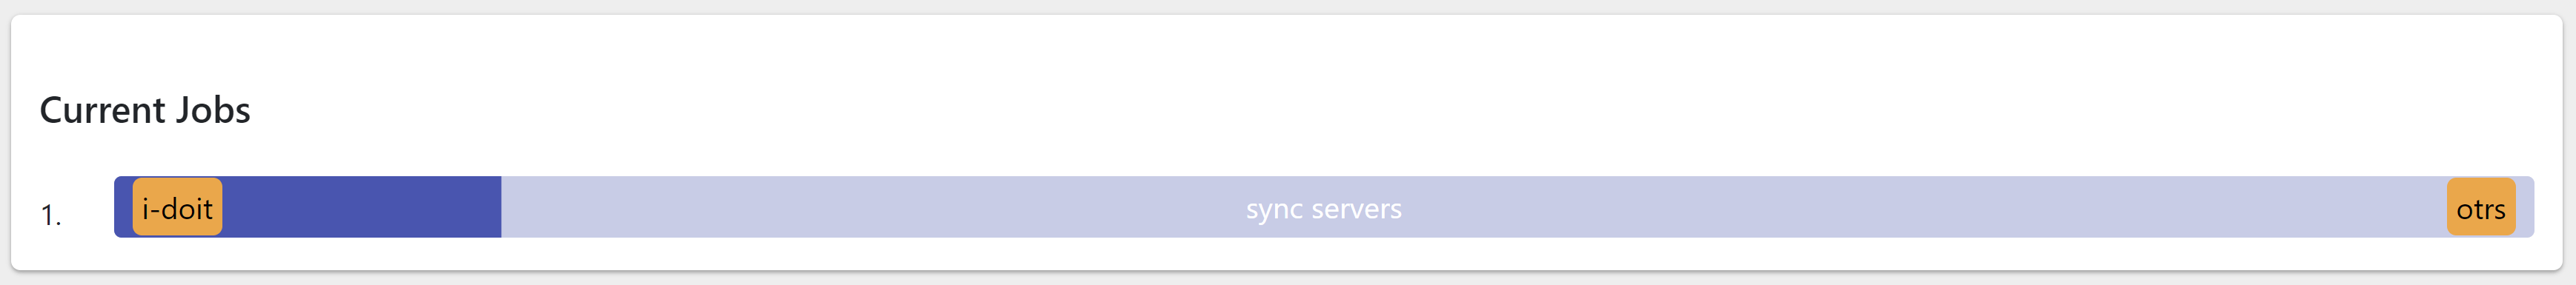
Below the list view, the progress of a connection is displayed if it has been started manually or automatically by a trigger. A running connection can be canceled by clicking on the “x” on the right side.
Adding a new schedule
To add a new job for the scheduler click on the button “Add Schedule”.

An empty mask opens where you have to enter the following information:
title (mandatory)
connection (mandatory)
logs (optional, disabled by default)
cron expression (optional)
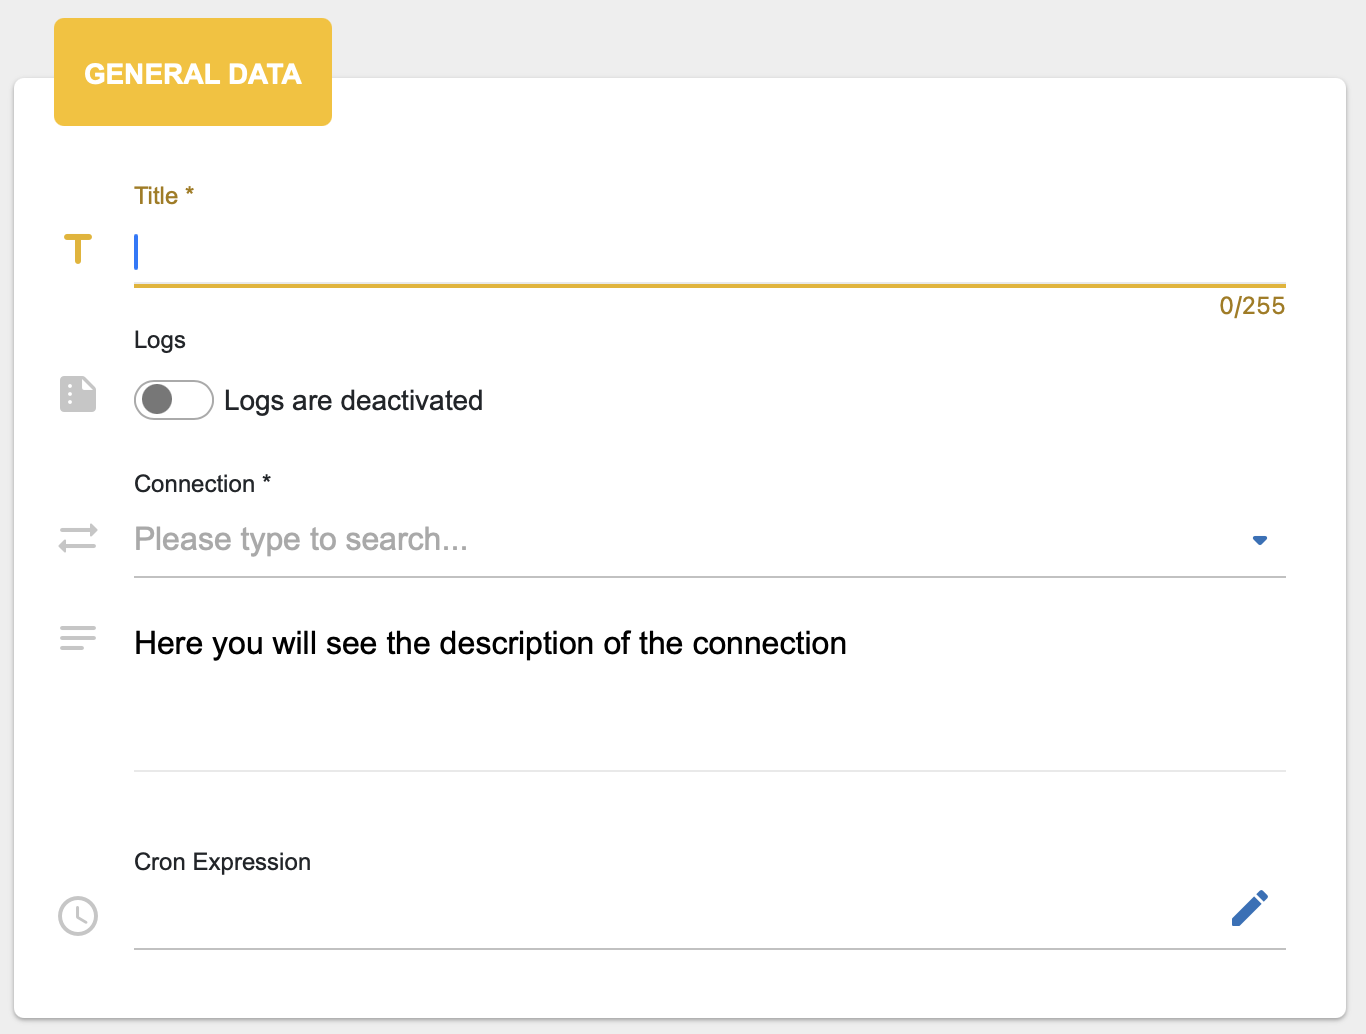
The title is displayed in the list of the Schedules panel. It should be descriptive to make it easy to identify the correct schedule.
Activate the logs if required; they are deactivated by default to avoid unnecessary logging. The logging function can also be activated later if required.
Use the search function or the drop down list to select one existing connection. The description of the connections is displayed as well to make the identification of the correct connection more easy.

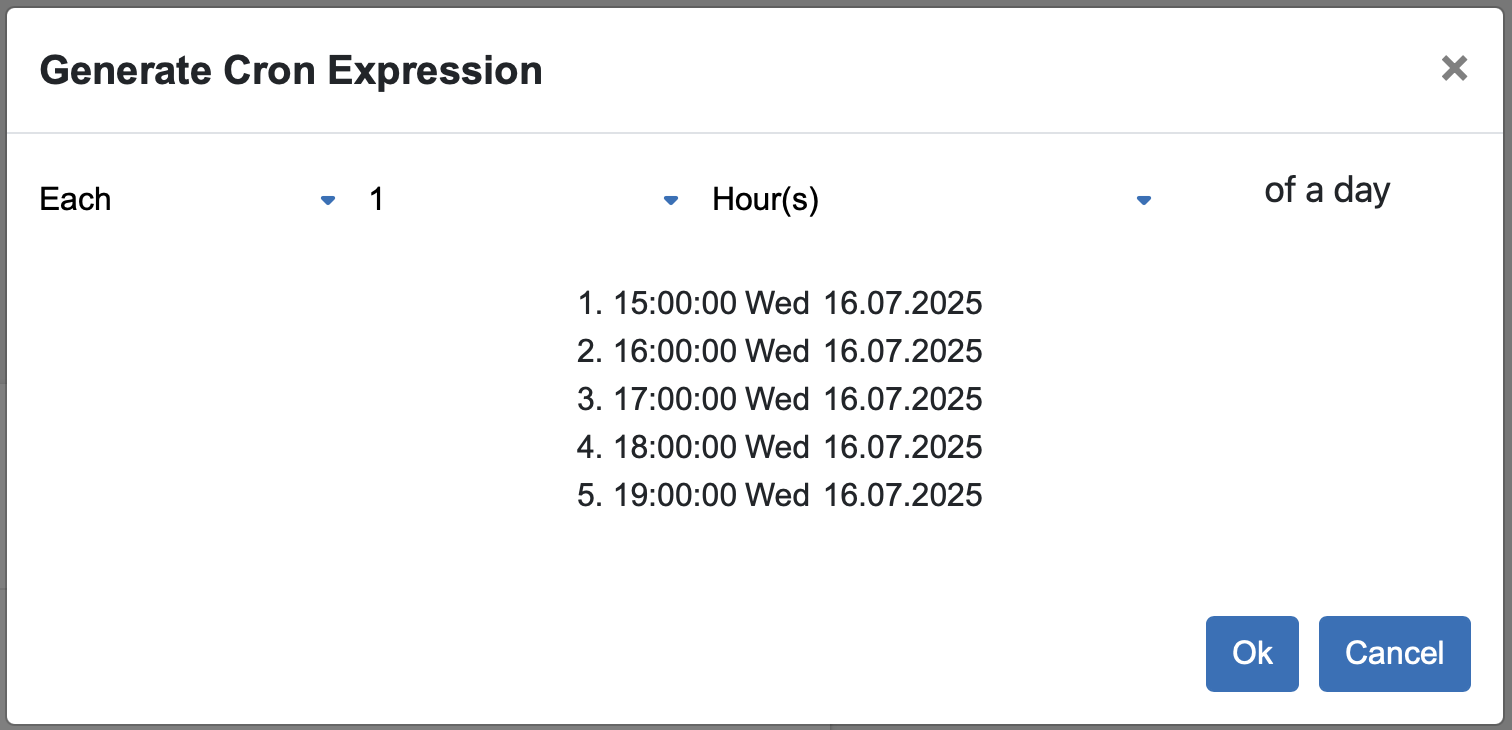
The definition of the cron expression can be done easily with the cron generator
![]() . Here you can choose the exactly or each timestamp when the job should
be triggered. Setting all data, you will see a list of the nearest triggering timestamps.
. Here you can choose the exactly or each timestamp when the job should
be triggered. Setting all data, you will see a list of the nearest triggering timestamps.
As soon as all required settings have been made click on the button “Add” sto save the schedule.
Cron Generator
The Cron Generator supports you in creating the most common cron expressions for triggering the schedules. To create a cron expression, select the desired values from the selection lists. Below the selection lists, you will see a preview of when the job would run with the current settings.
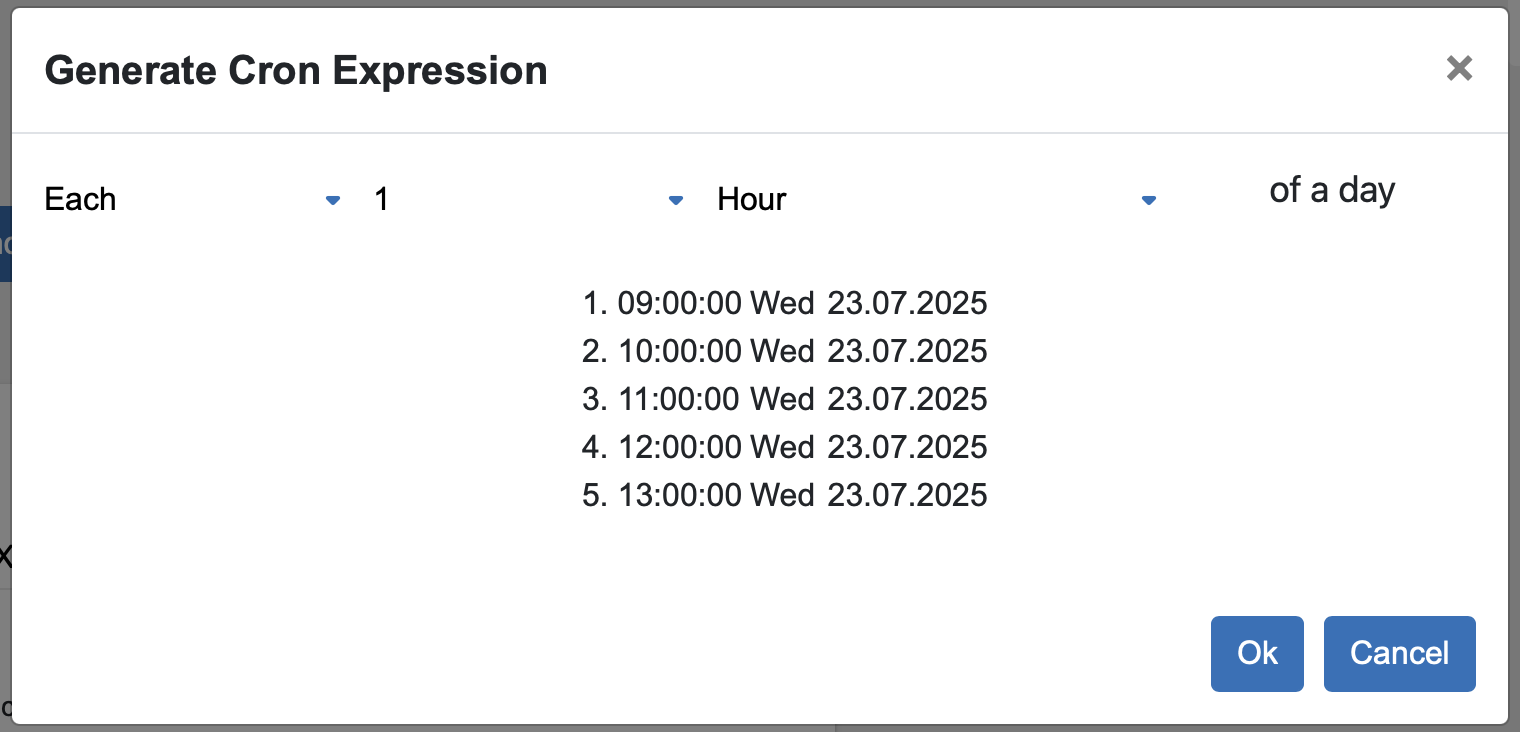
Once you have made the desired settings, confirm the settings by clicking on the “OK” button.

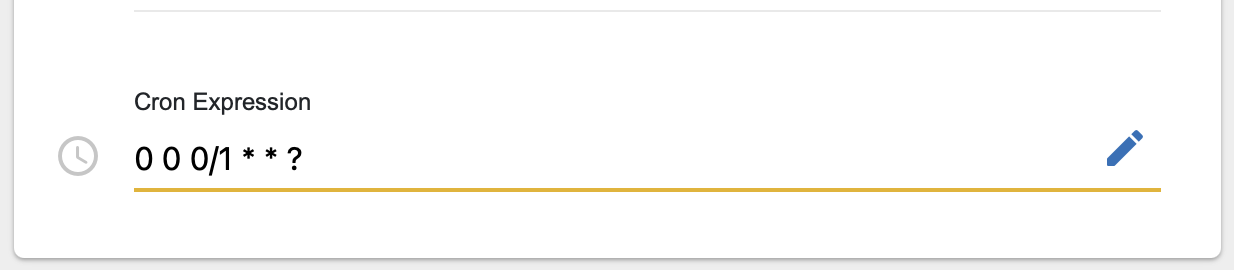
The finished expression is now displayed in the “Cron Expression” field. Alternatively, you can also enter an expression directly in the “Cron Expression” field.
A cron expression is a string comprised of 6 or 7 fields separated by white space. The first 6 fields are mandatory, the last field is optional. The following fields are used in a cron expression:
Second
Minute
Hour
Day of the month
Month
Day of the week
Year (optional)
Save the schedule by clicking on the “Add” or “Update” button.
 or
or 
OpenCelium uses the Quartz Job Scheduling Library for the cron jobs.
On the Quartz page you will find examples for the correct creation of cron expressions, which can be used in OpenCelium.
Examples:
0 0 12 * * ?
Meaning: Run at 12pm (noon) every day
0 15 10 * * ? *
Meaning: Run at 10:15am every day
0 0/5 14,18 * * ?
Meaning: Run every 5 minutes starting at 2pm and ending at 2:55pm, AND fire every 5 minutes starting at 6pm and ending at 6:55pm, every day
Webhook
A webhook allows a connection to be triggered using a URL that is called up. A
webhook can be created for each schedule by clicking on the corresponding action for creating
a webhook ![]() .
.
If a webhook has been created for a schedule, this can be seen from the corresponding
icon ![]() in the column Webhook.
in the column Webhook.
Clicking on the icon ![]() copies the URL of the webhook to the clipboard so that it can be
inserted at the desired location.
copies the URL of the webhook to the clipboard so that it can be
inserted at the desired location.
Clicking on the icon ![]() disables the webhook for the respective schedule again.
disables the webhook for the respective schedule again.
Notifications
The notifications are a feature that allows you to be informed about certain events via e-mail or webhook. The available events are pre, post and altert.
pre - notification is triggered before the schedule
post - notification is triggered after the schedule
altert - notification is triggered in the event of an error.
Note
The aggregator only applies for post events.
You can assign a notification to several schedules. To do this, select the desired schedules in the
list by clicking on the checkboxes and click on the “Notification” button  .
.

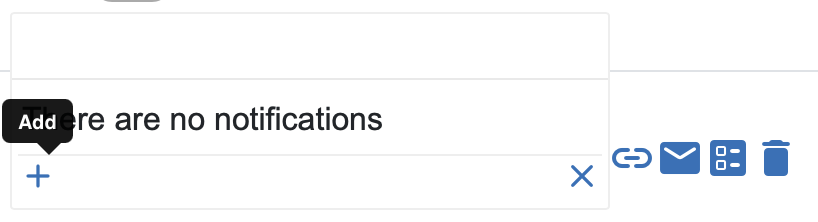
If you only want to assign a notification to one schedule, you can alternatively click on the letter
symbol  and then on the plus sign to create a new notification.
Note
Before you create a notification, you need to create a template that is described here.
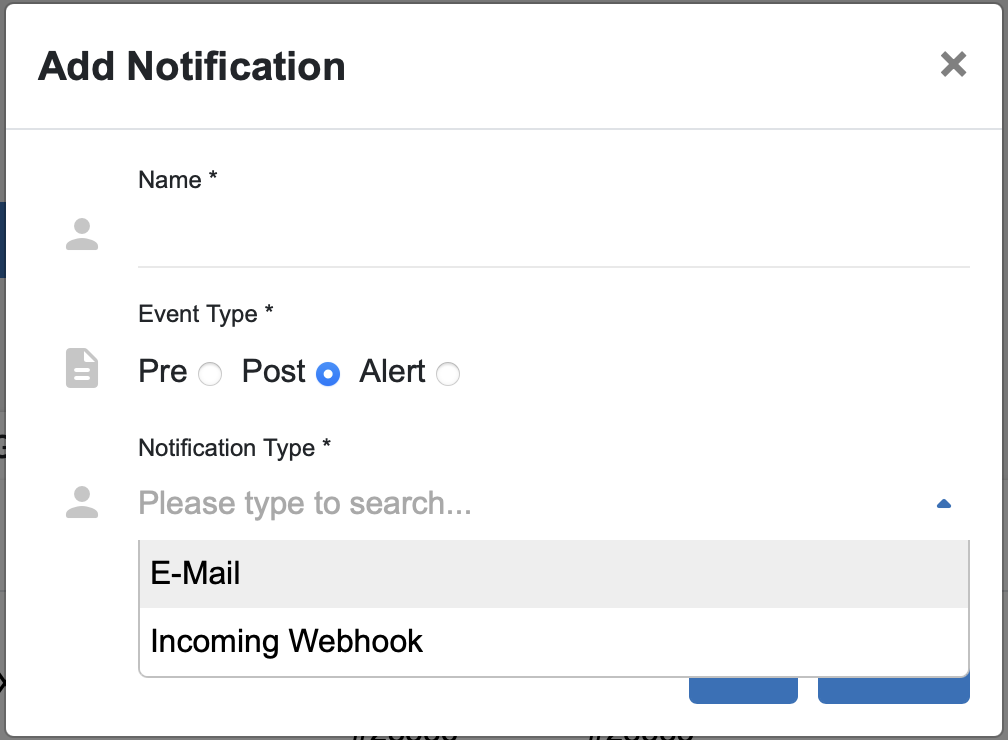
After clicking on “Add”, provide name, event, notification type and after template.

Select the desired notification type (E-Mail or webhook). For E-mail type you need to select the recipients who gets a notification. For webhook type you need to provide the webhook of the target system.
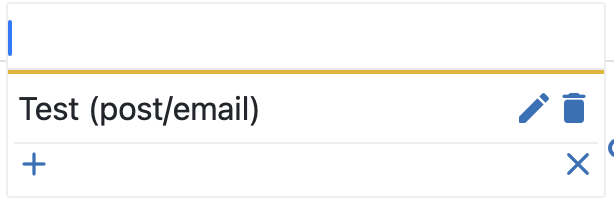
After creating the notification you will see a list of notifications and a search where you can search for a notification by name, event or notification type. You can update or delete the corresponding notification, if you mouse over on one of them and click on the respective icon.
Execution Logs
Each job in the Scheduler includes a detailed Execution Log view. The log viewer uses the same interactive UI-Log interface as the Test-Run feature in the Connection Editor, allowing users to inspect requests, loops, and responses in a structured, tree-based layout.
For each scheduled job, the system automatically maintains historical logs for both successful and failed executions:
Success Logs: retain the two most recent successful runs
Fail Logs: retain the three most recent failed runs
This retention behavior can be adjusted in the backend configuration file (application.yml):
log:
  retention:
    per-connection:
      success: 2
      fail: 3
Adjusting these values changes how many historical logs are stored per connection or scheduled job. Older logs exceeding the defined retention limits are automatically removed.
Note
To ensure that the logs are created according to the configuration, they must be activated for the
respective job (the switch  in the column Logs must be active).
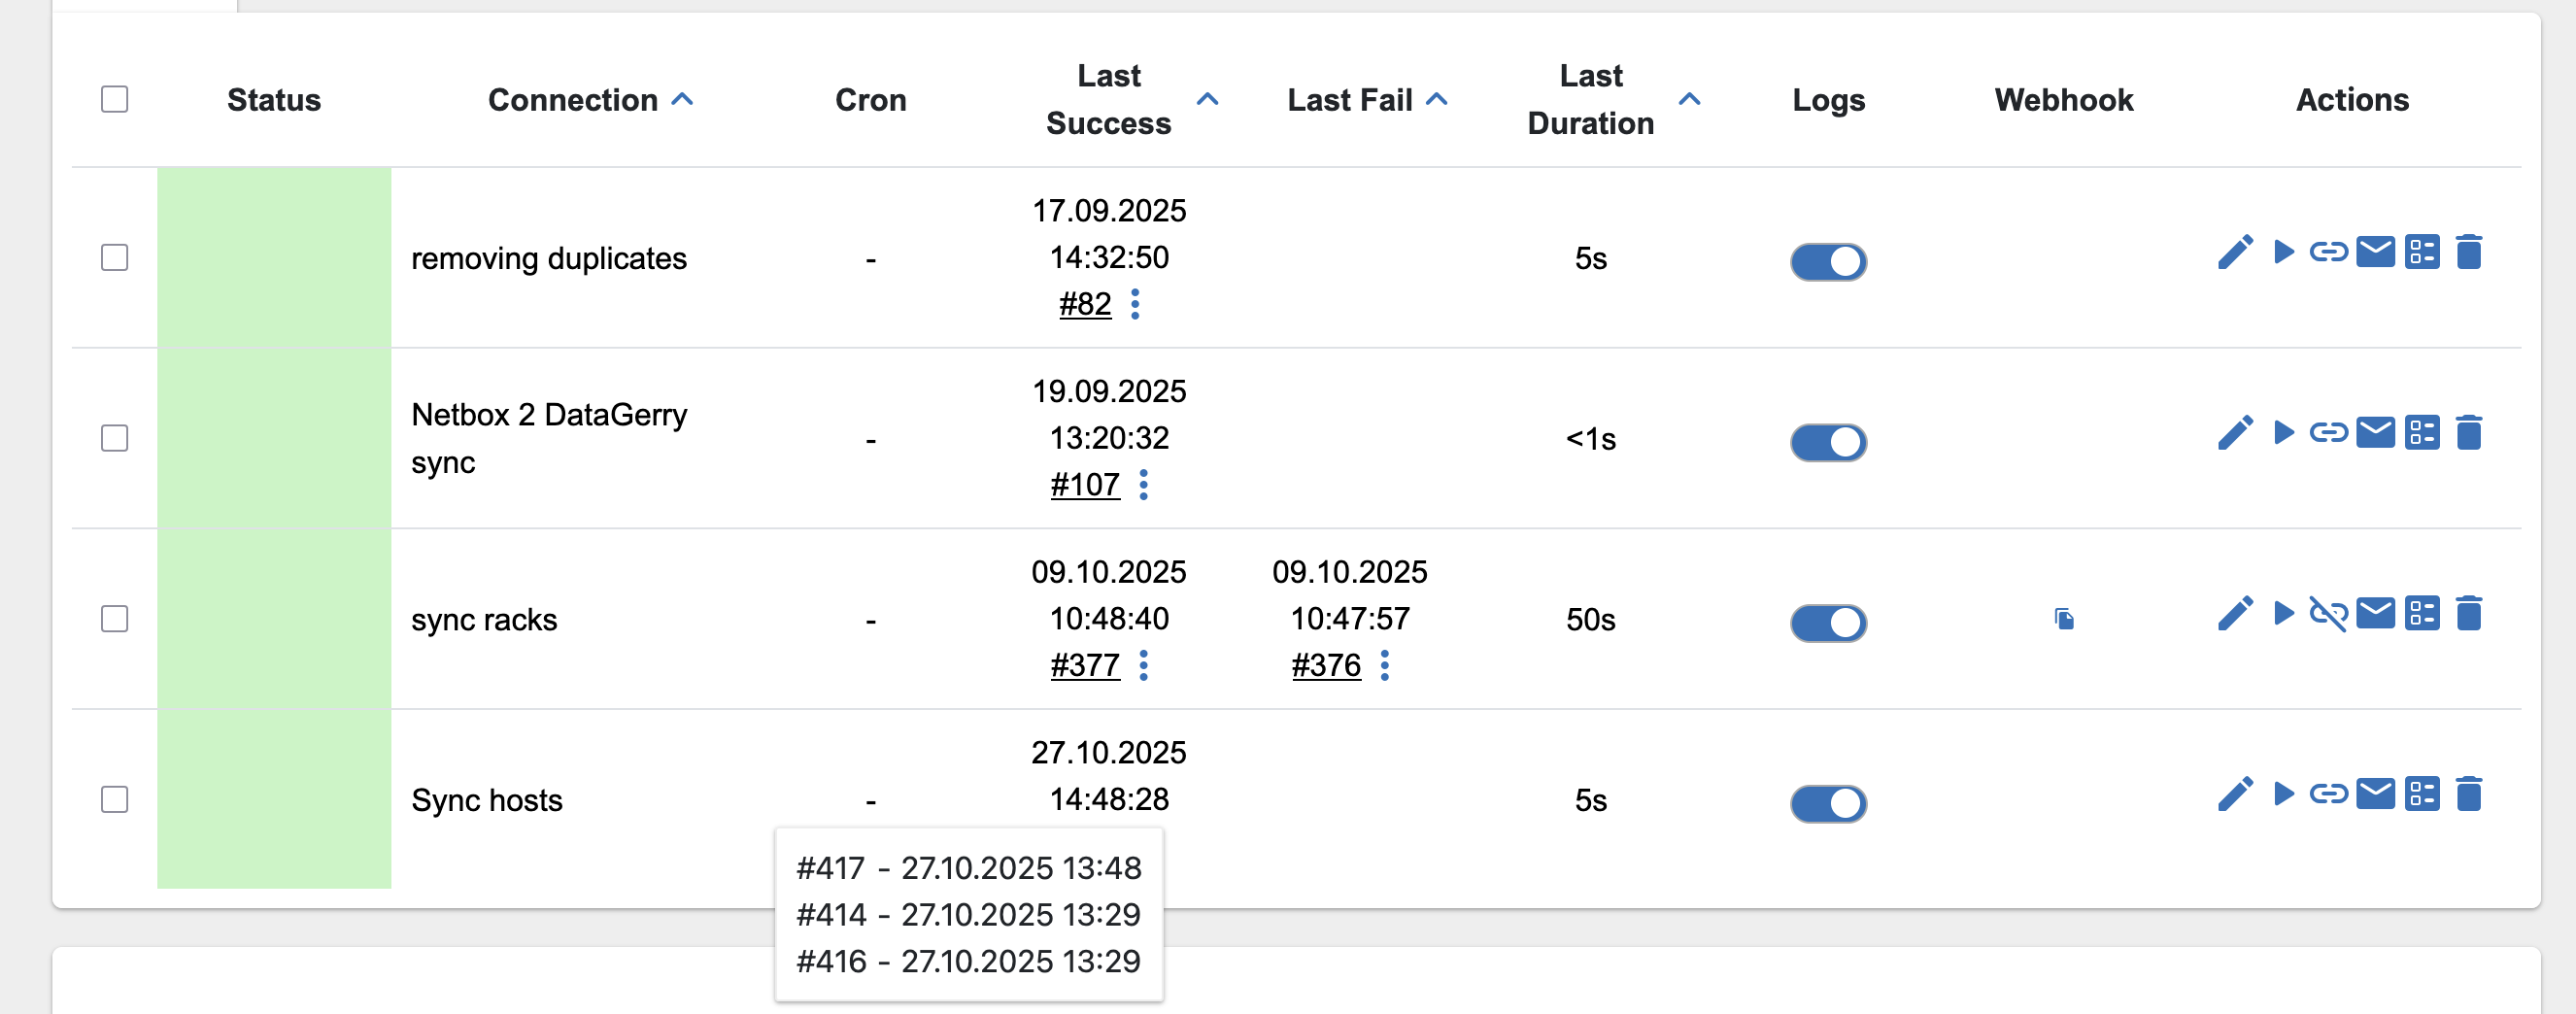
The entries in the columns Last Success and Last Fail give you direct access to the corresponding logs. Click directly on the job number to open the log in the log viewer. The three dots also give you access to the logs of past jobs (if configured).
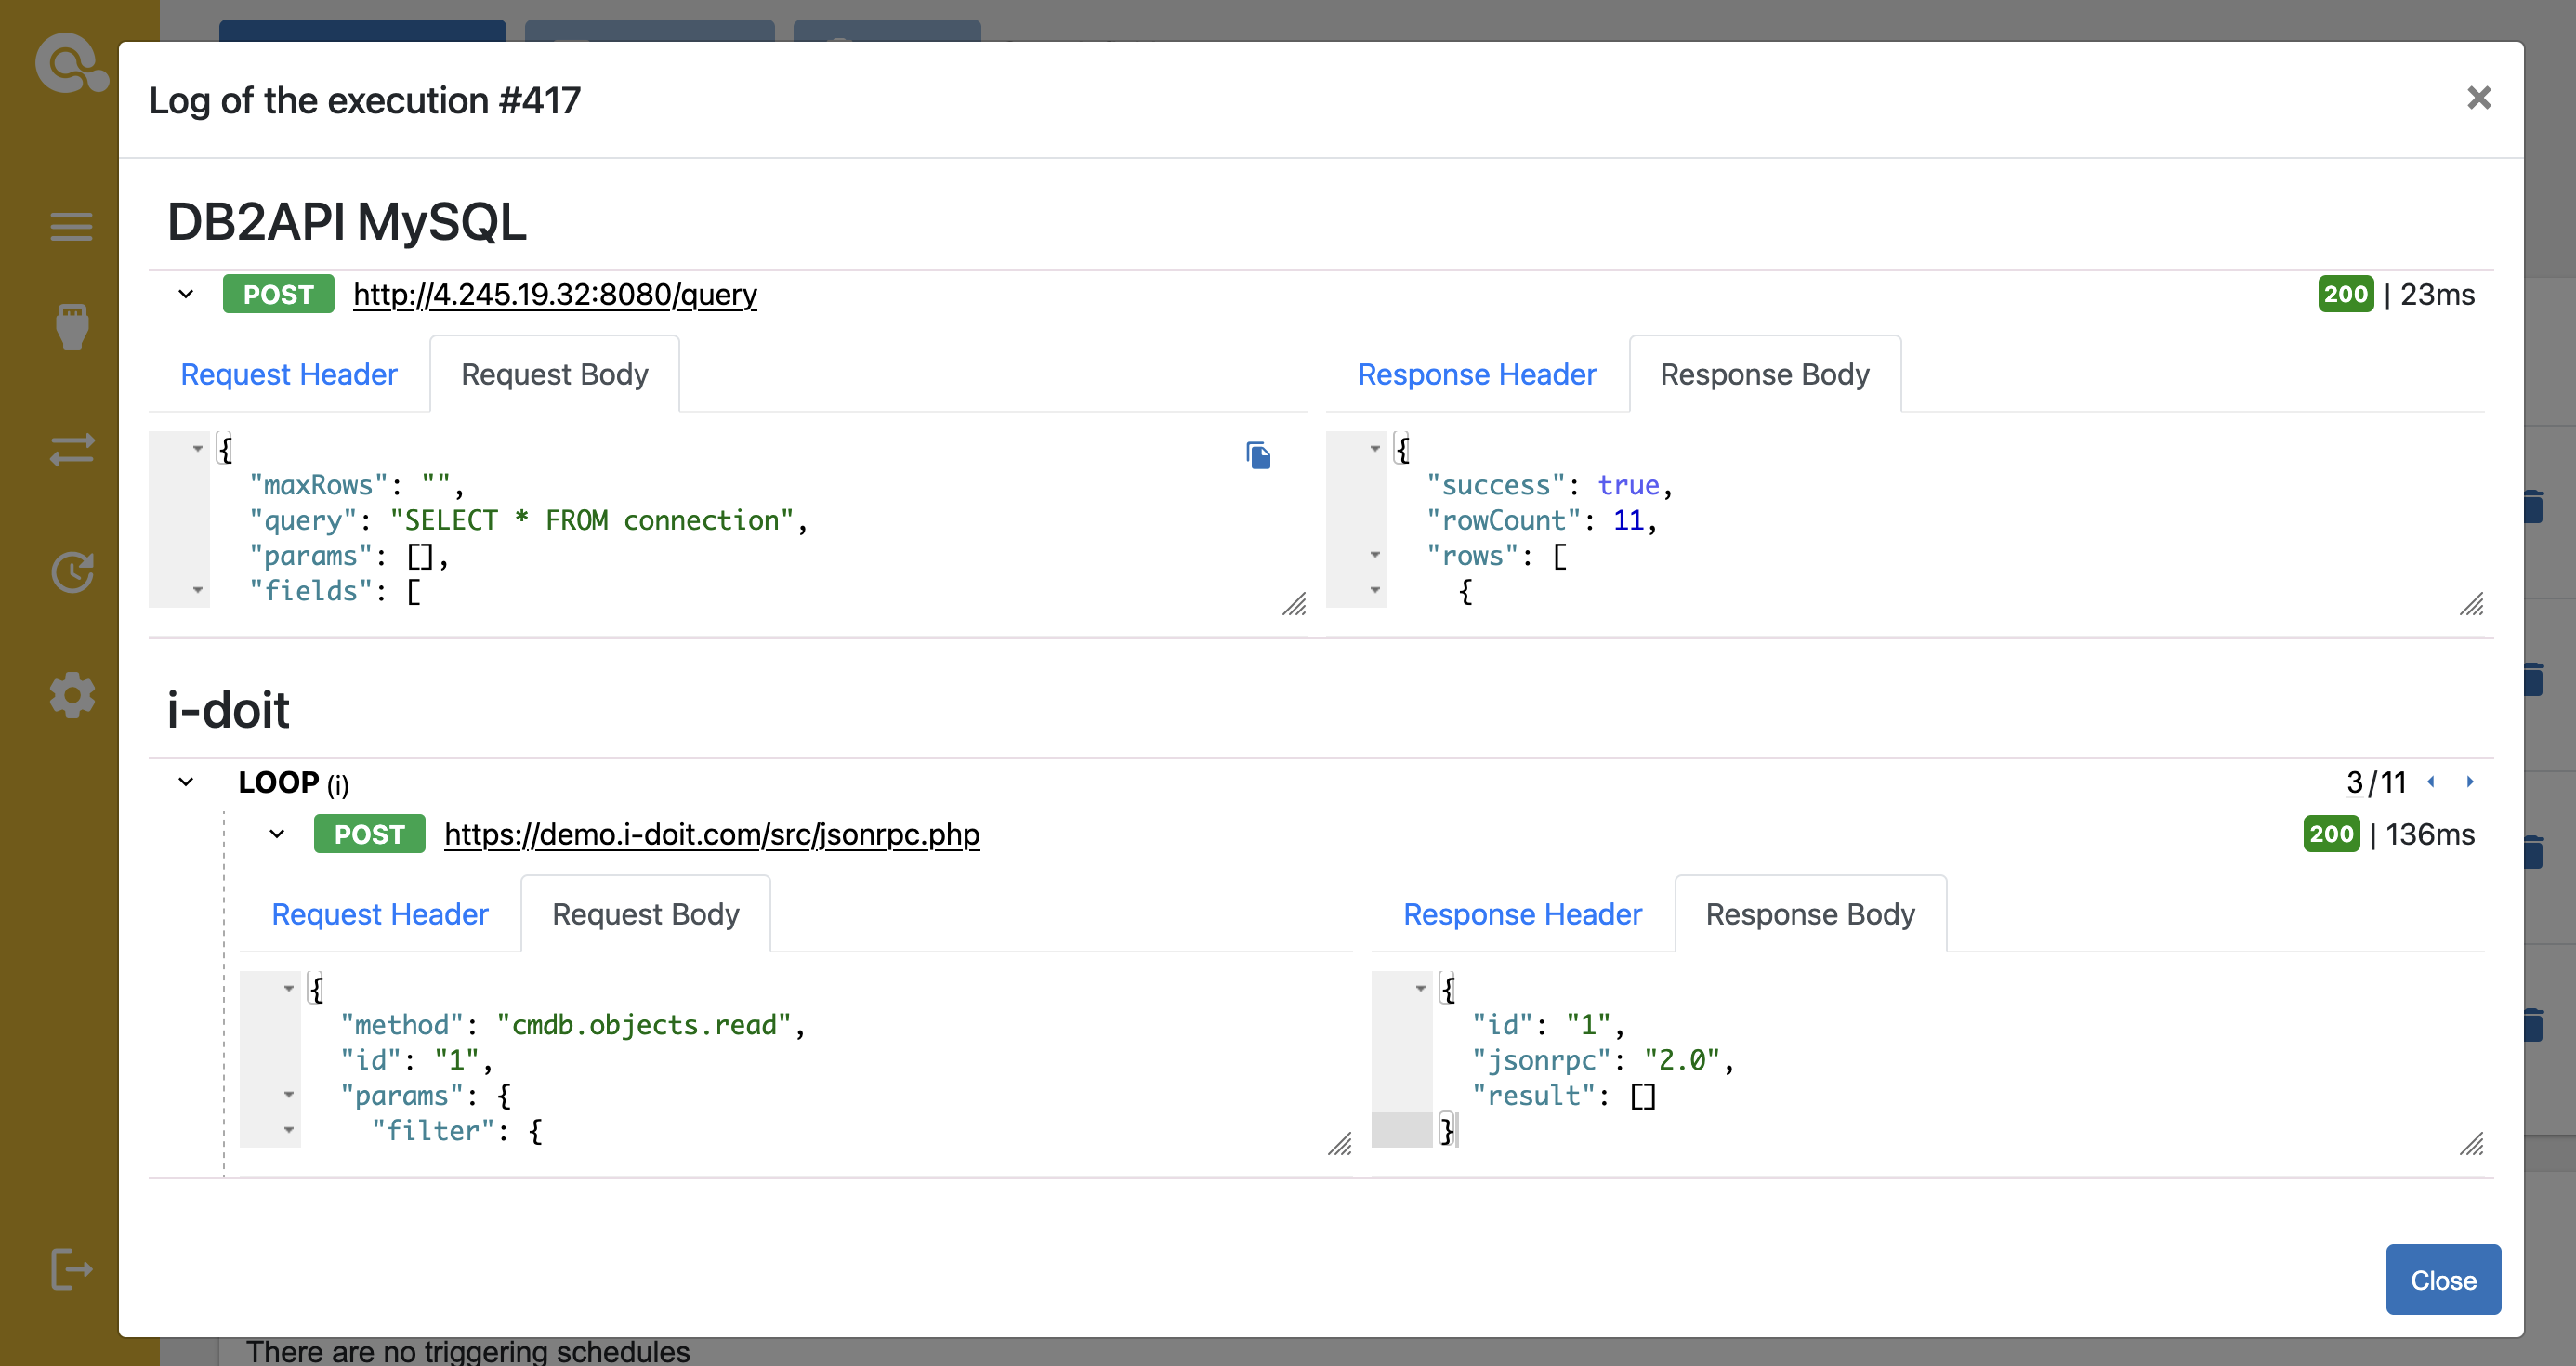
…and this is the UI log viewer, which we also use for the test run.
Support Logs
The Logs feature allows you to create comprehensive log files for support in case your connection is not working and you need help troubleshooting.
Clicking on the ![]() icon opens a view where you can configure the support logs as
needed by masking certain parts of the logs.
icon opens a view where you can configure the support logs as
needed by masking certain parts of the logs.
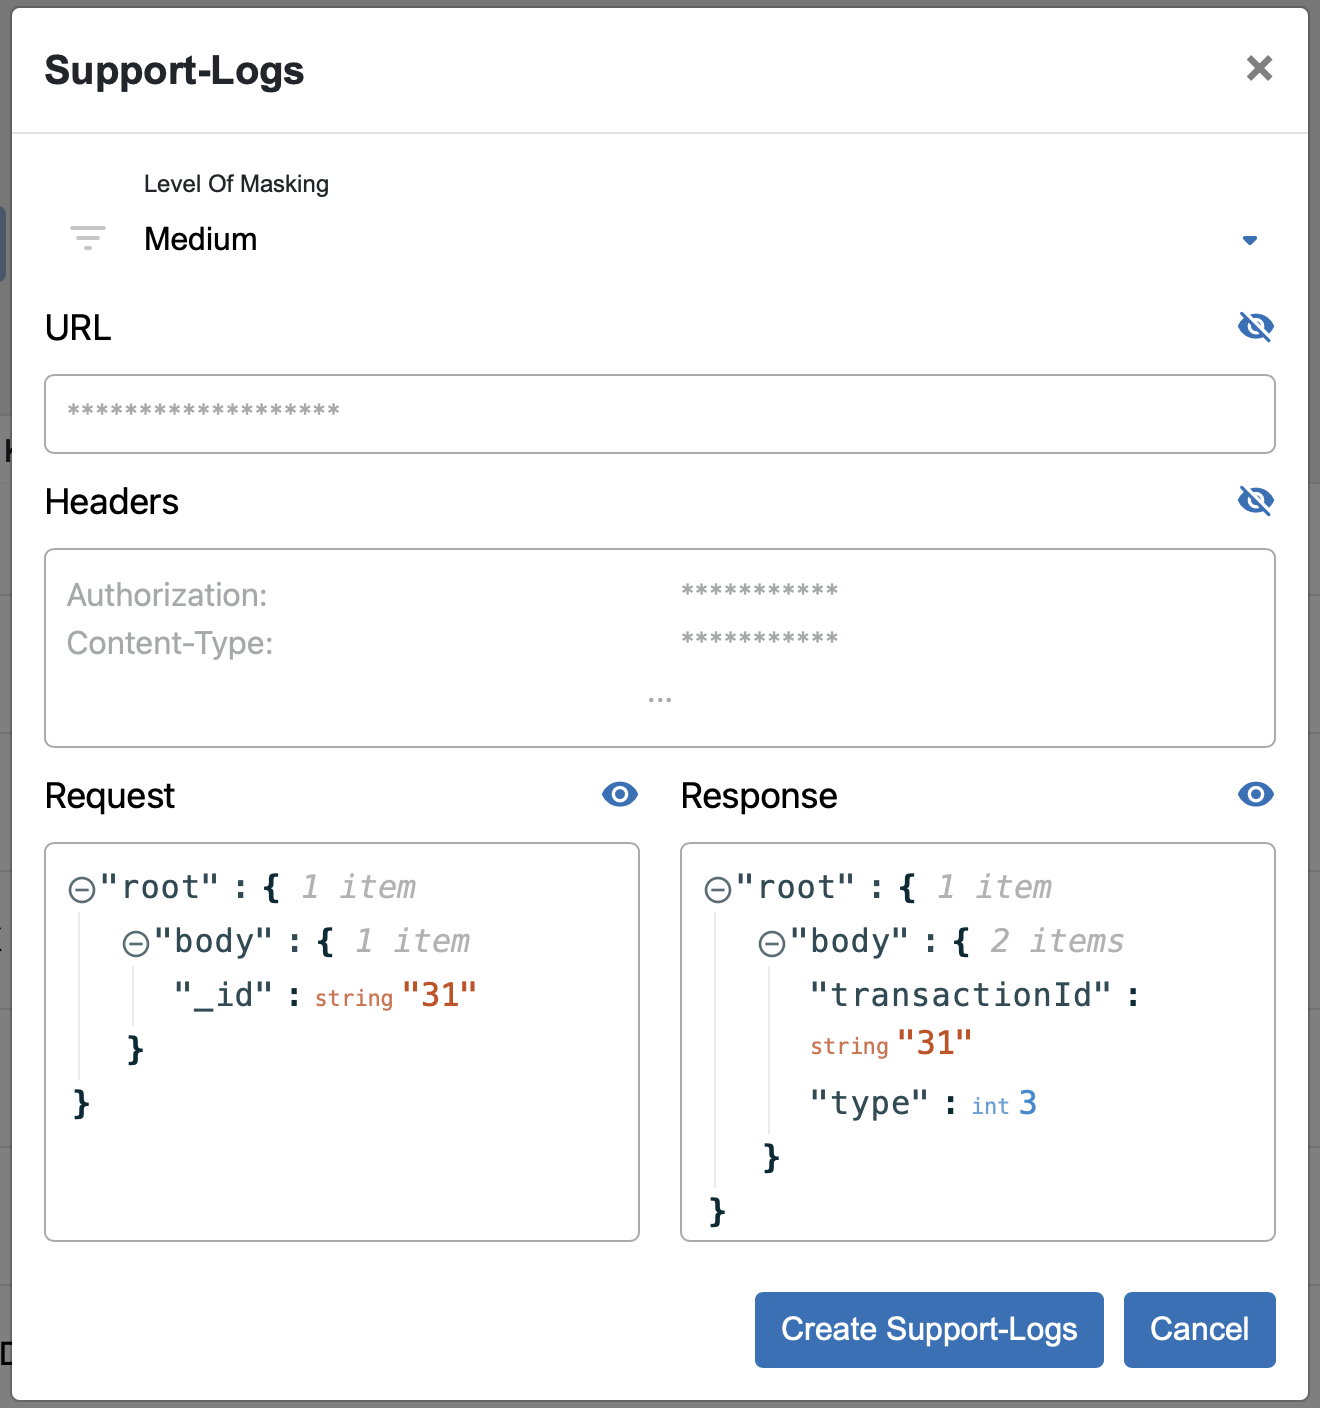
In the upper area, you can select a desired preset for the degree of masking.
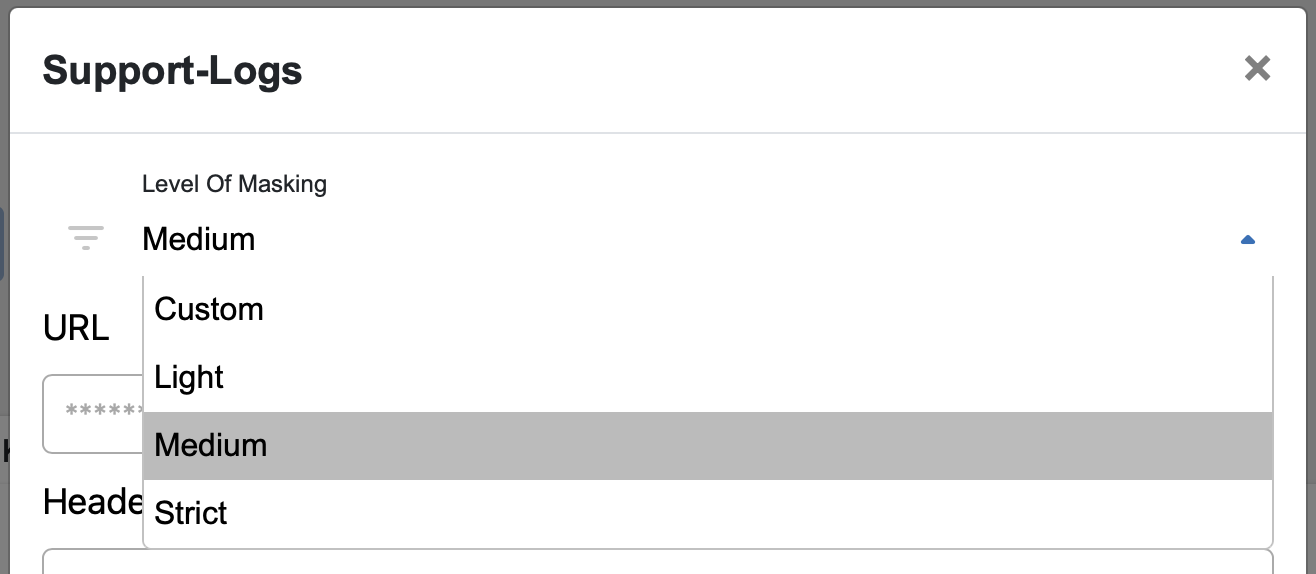
The following levels are available:
Masking Level |
URL |
Headers |
Request |
Response |
|---|---|---|---|---|
Light |
|
|
|
|
Medium |
|
|
|
|
Strict |
|
|
|
|
Custom |
|
|
|
|
Alternatively, you can also select individual elements and mask them by clicking on the icon with the
crossed-out eye ![]() , thus making them unrecognizable for support. Clicking on the icon with the uncrossed
eye unmasks the element again
, thus making them unrecognizable for support. Clicking on the icon with the uncrossed
eye unmasks the element again ![]() .
.
Once you have made the desired settings, click on the button to generate the support logs.

The process of generating the support logs starts the selected connection, generates the logs, and saves them together with the invoker files as a ZIP file. Corresponding messages in the notifications indicate the start and successful generation of the support logs.
The generated support logs can be accessed either via the link in the notification or under Support Files in the admin panel.