Connections
Connection List
Connection defines between which connectors we want to do requests, what kind of requests and to specify mapping between them. This is a core element of the application. The list of connections displays a title, a description, and connectors’ titles.
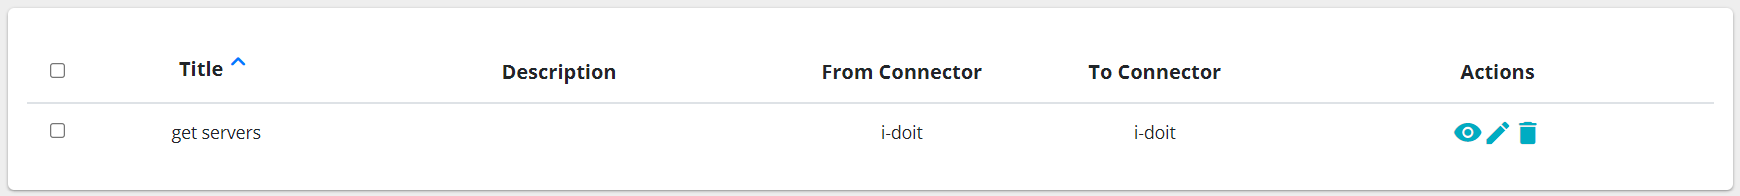
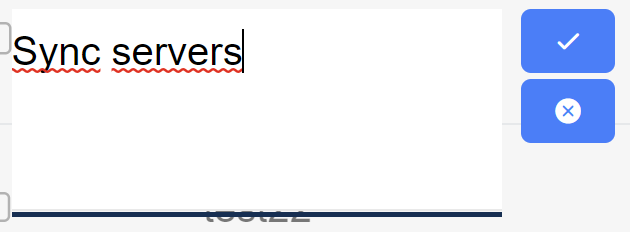
If you double click on the title or on the description, you can modify it inline.
There are also categories above the list. The category collects a set of connections. It can be very helpful to divide connections. As an example, you can have a demo category for your demo installations.
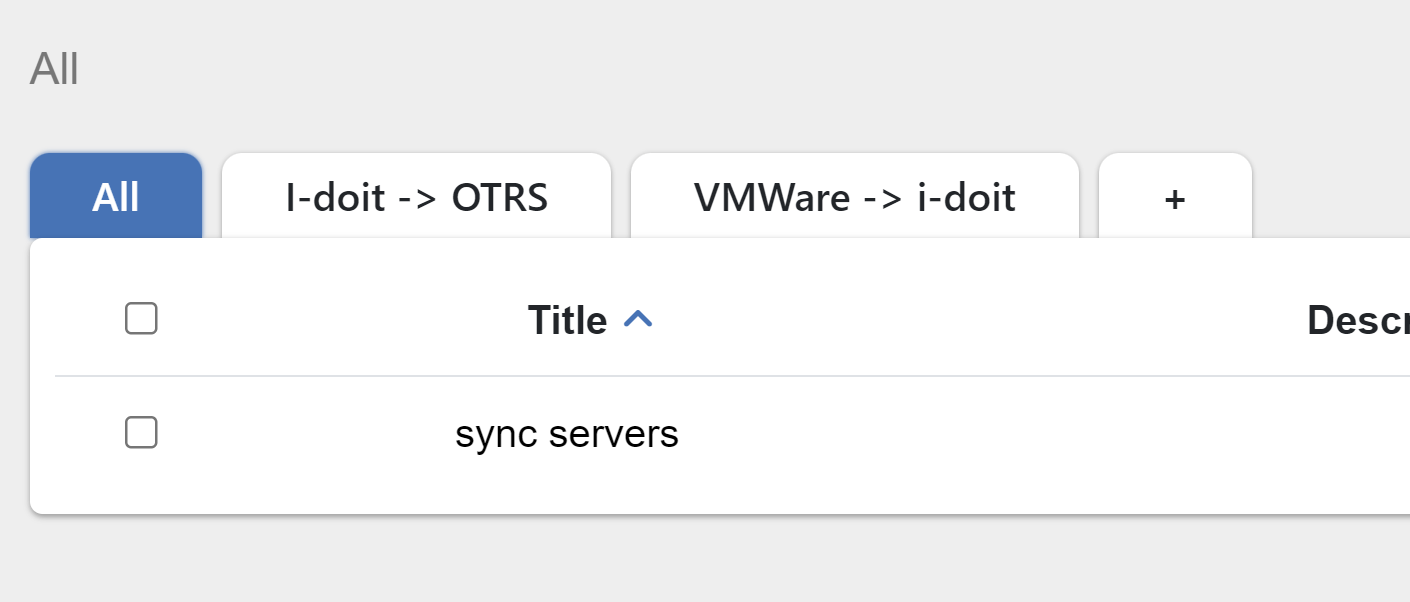
You can create a category clicking on the + icon. Each category can have subcategories. The path to the parent category will be displayed above as breadcrumb.
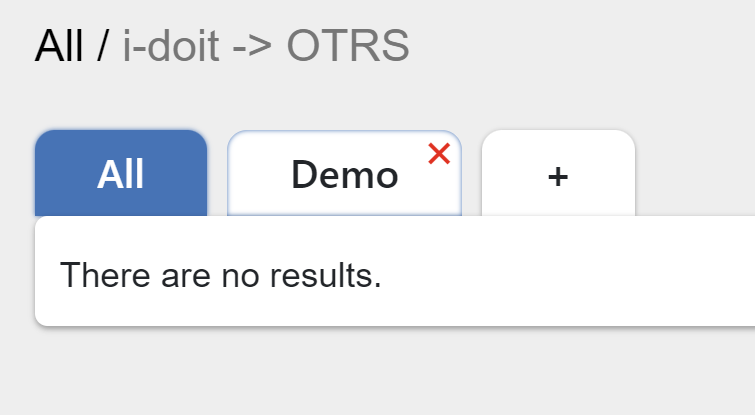
Each breadcrumb header is a link to the previous category. To delete the category, just put your mouse over the category title and click on the x icon. The dialog will pop up that suggests you to delete recursively.
Warning
If you delete the category recursively, all subcategories and assigned connections will be removed.
Create Connection
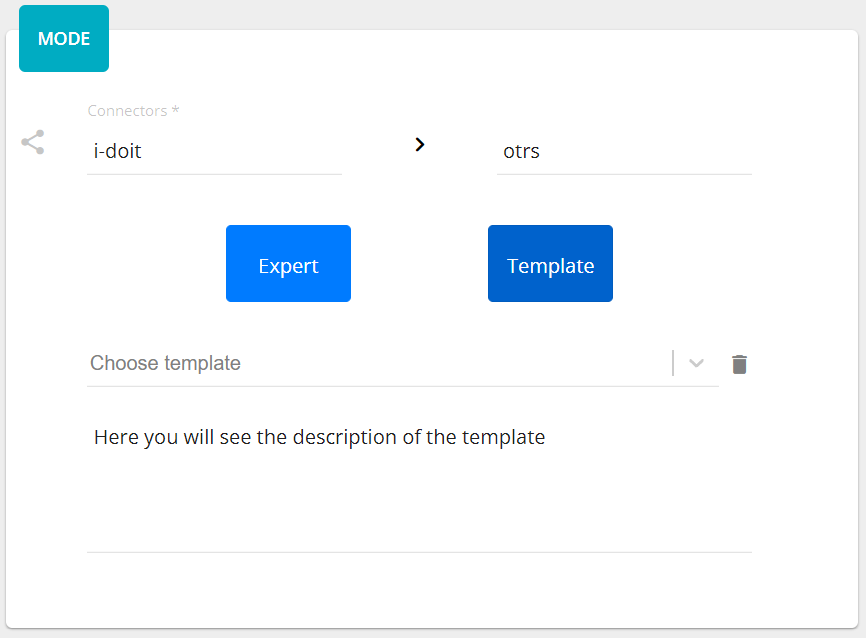
Adding connection has three steps: direction, mode, and methods. Updating connection has just one methods. The direction page has three fields: title, description and connectors. Title and connectors are required. The title must be unique, it is checking before performing an action (add/update). The connectors are two: from connector and to connector. The options are loaded from the connectors list.

The mode step has one required field - mode. It can be an expert or
a template. If the template is chosen, their will be appeared a select
field, where you need to select a desired template. Here also you can delete
it, clicking on the bin icon, or upgrade, if the template need to be upgraded
to the current application version. There is also a possibility to create a new
template basing on the current connection pressing on the button  and defining a template name and optionally a template description.
If you change the mode it will affect on the “methods”, that is why you need to confirm your choice.
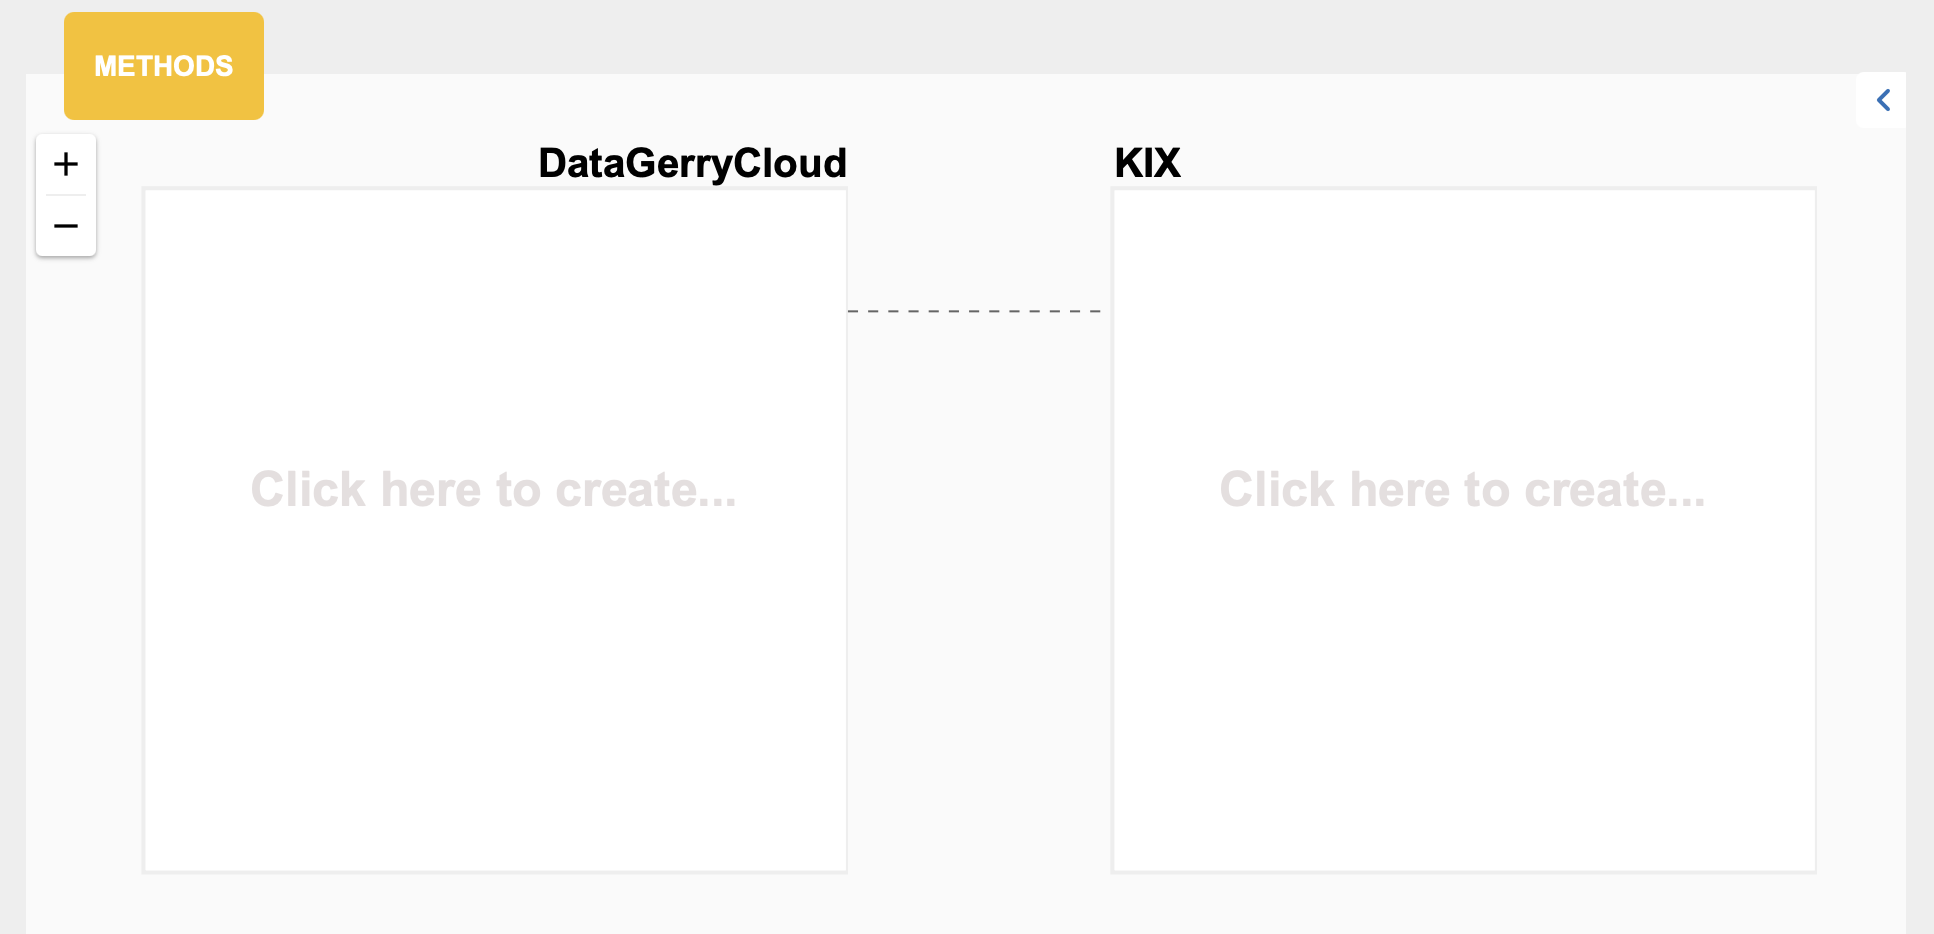
The method represents the request to the connector with defined parameters. There are two types of elements: method and operator. The area consists of visual representation of methods/operators and a panel Details. Clicking on the text Click here to create… or moving pointer above the existed element you will see a placeholder for creating process or operator.

The element will be located after the current element and set as a new current. Each method has his own color that generates automatically. Also, you can set a label for your personal better reading. To remove a method or an operator just click on the bin icon of the selected element. The Details panel displays information about the selected element.
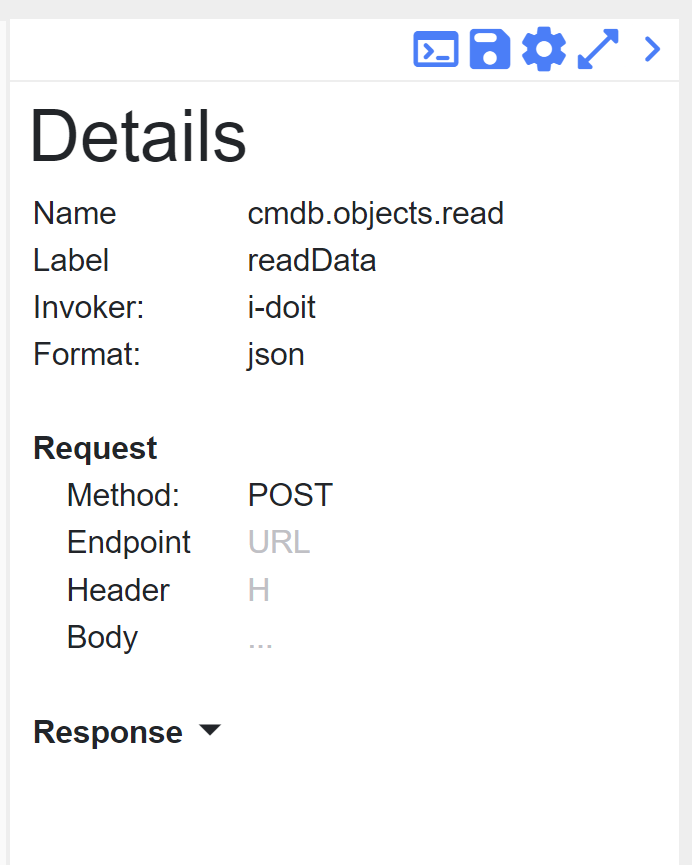
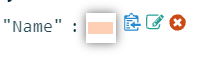
If you want to set or to change the Label of the connection, just move your mouse
over it in Details and click on edit icon. Under the Format you can find an
Aggregator that also could be (re)set. If you want to know more, please
read data aggregator.
You can create a new aggregator pressing on the button  .
.
In the Details panel you can see Endpoint and Body under the Request paragraph that could be modified clicking on their placeholders.
Operators
Since version 4.5, the use of operators has been significantly simplified. Instead of inserting several operators with individual conditions one after the other into the connection, it is now sufficient to add one operator. An operator can now contain several conditions, which can be linked with AND or OR as desired. In addition, multiple groups with different conditions can be mapped to enable complex queries.
Adding an operator
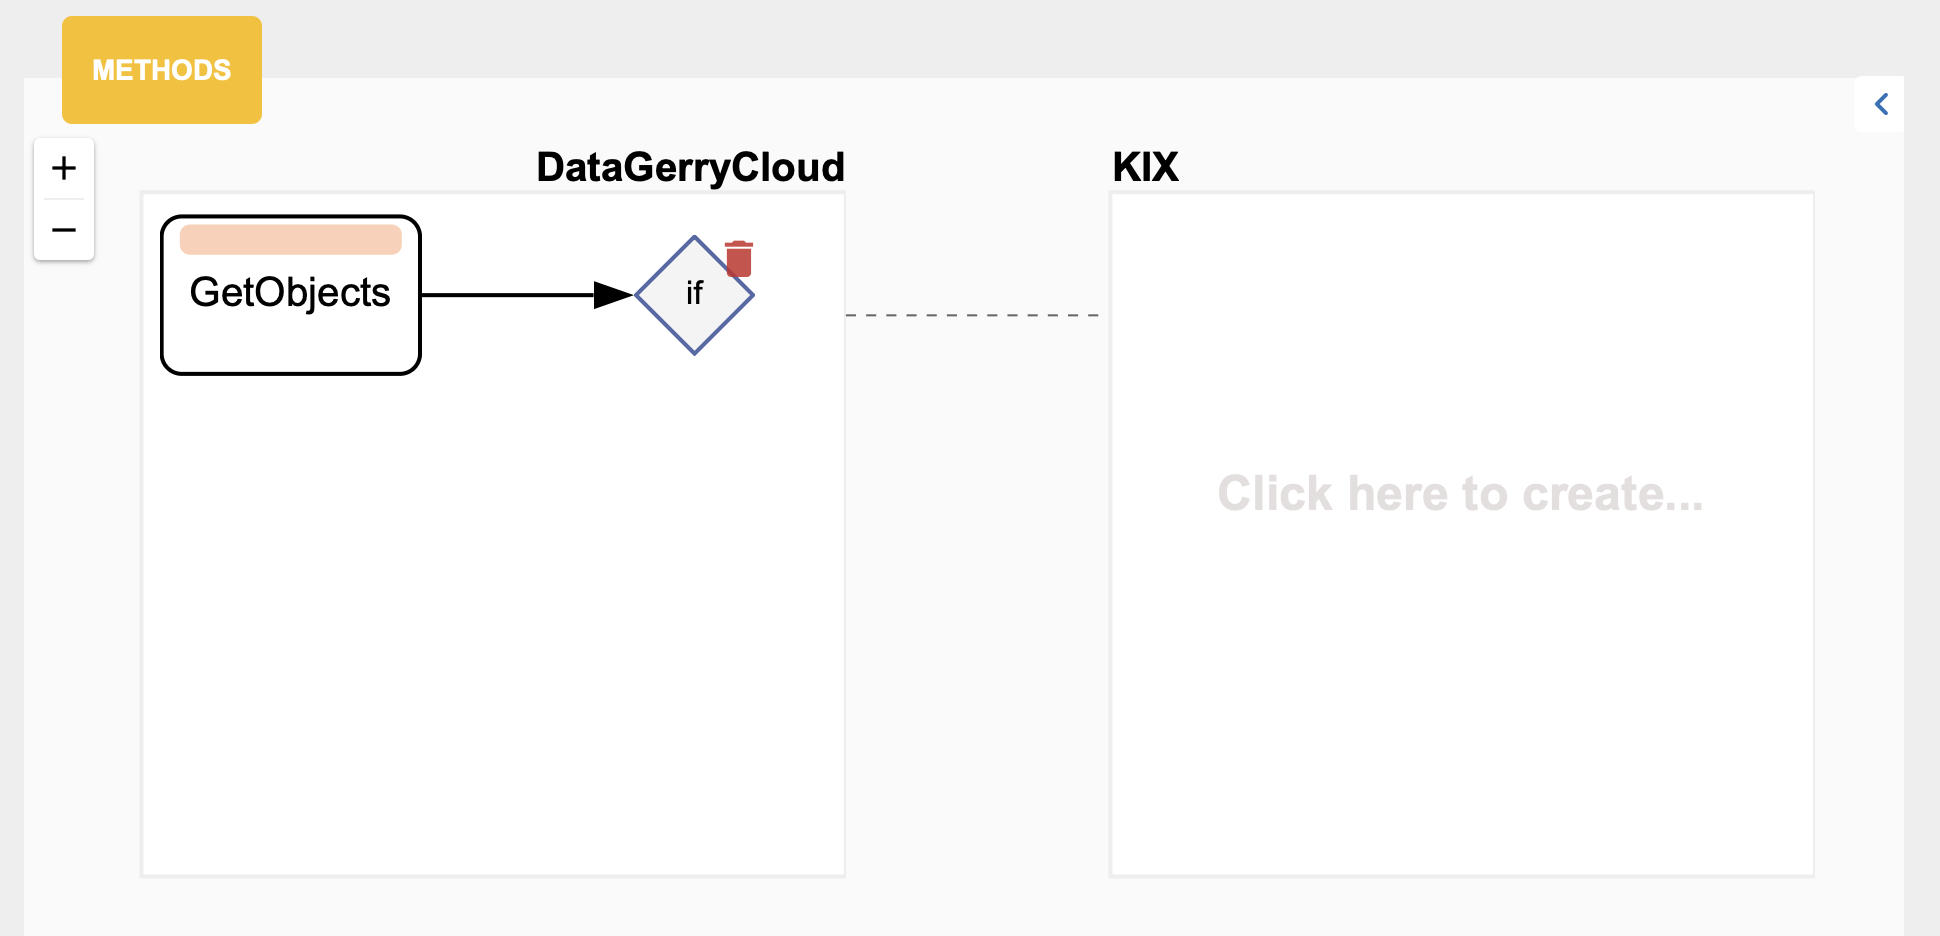
If you are creating a completely new connection and no methods or operators are included yet, you can simply click on the empty area labeled “Click here to create…” in the connection editor to display the context menu for adding a method or operator.
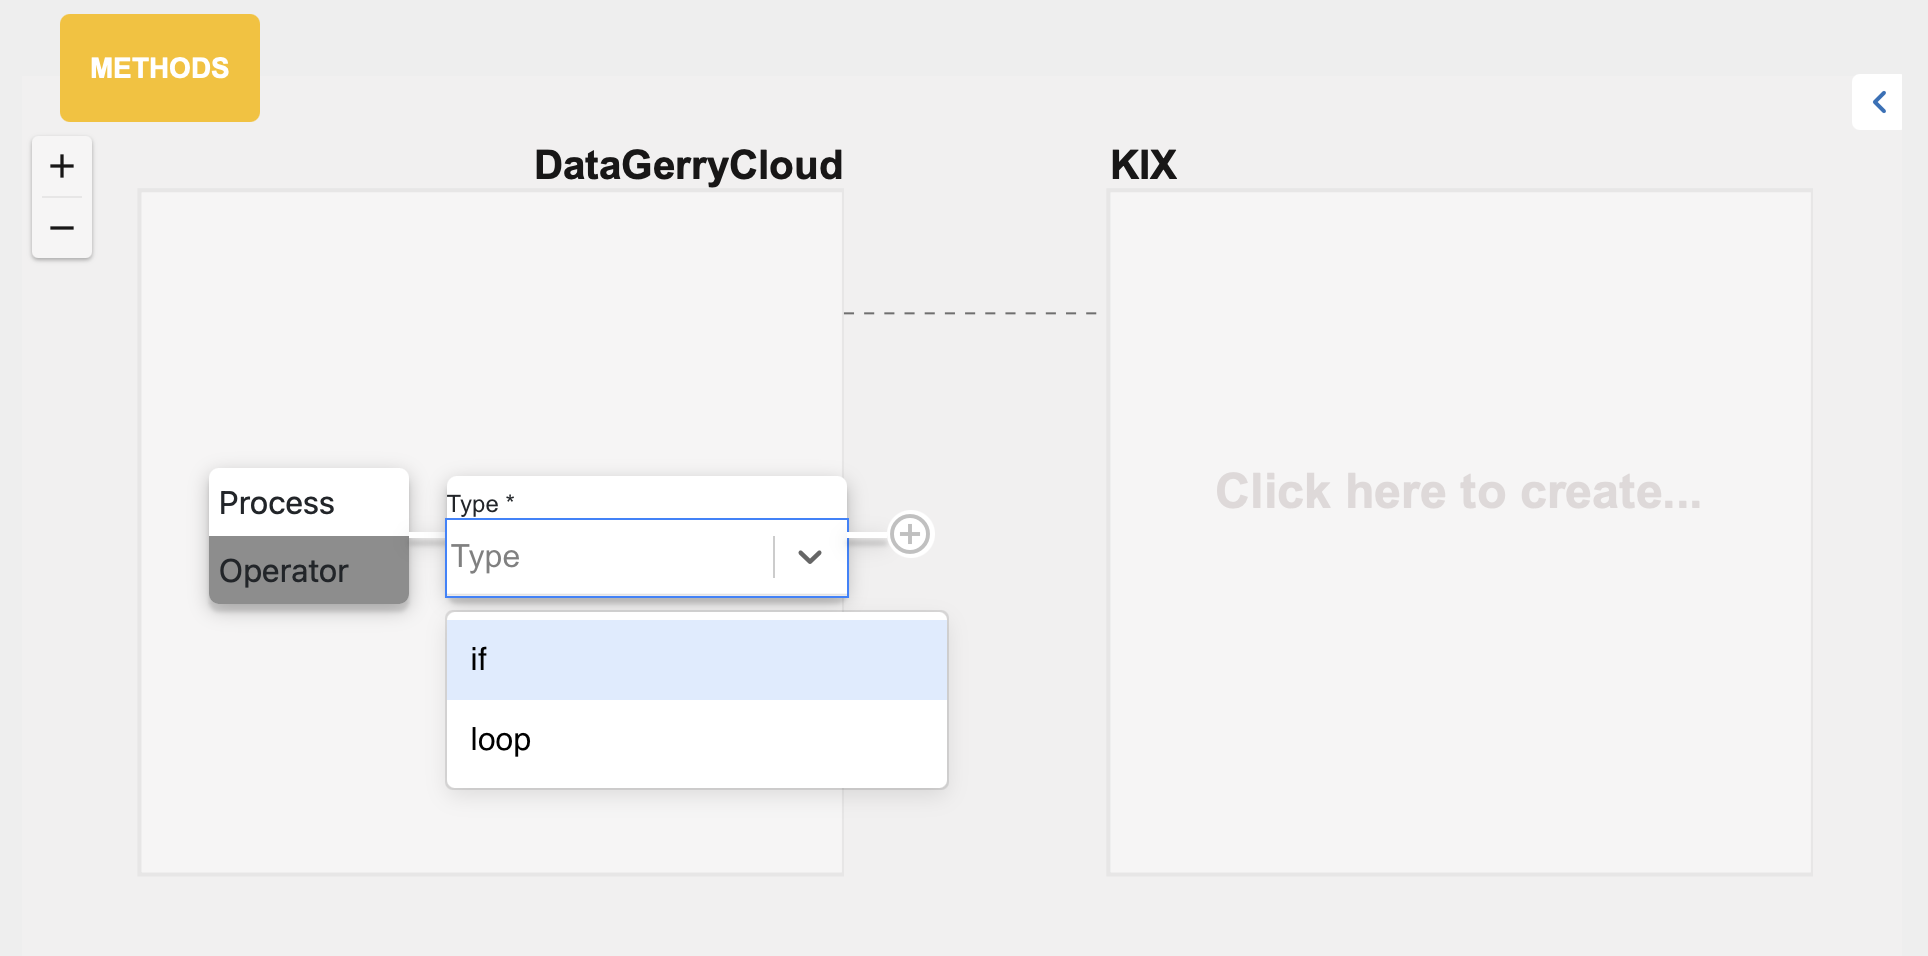
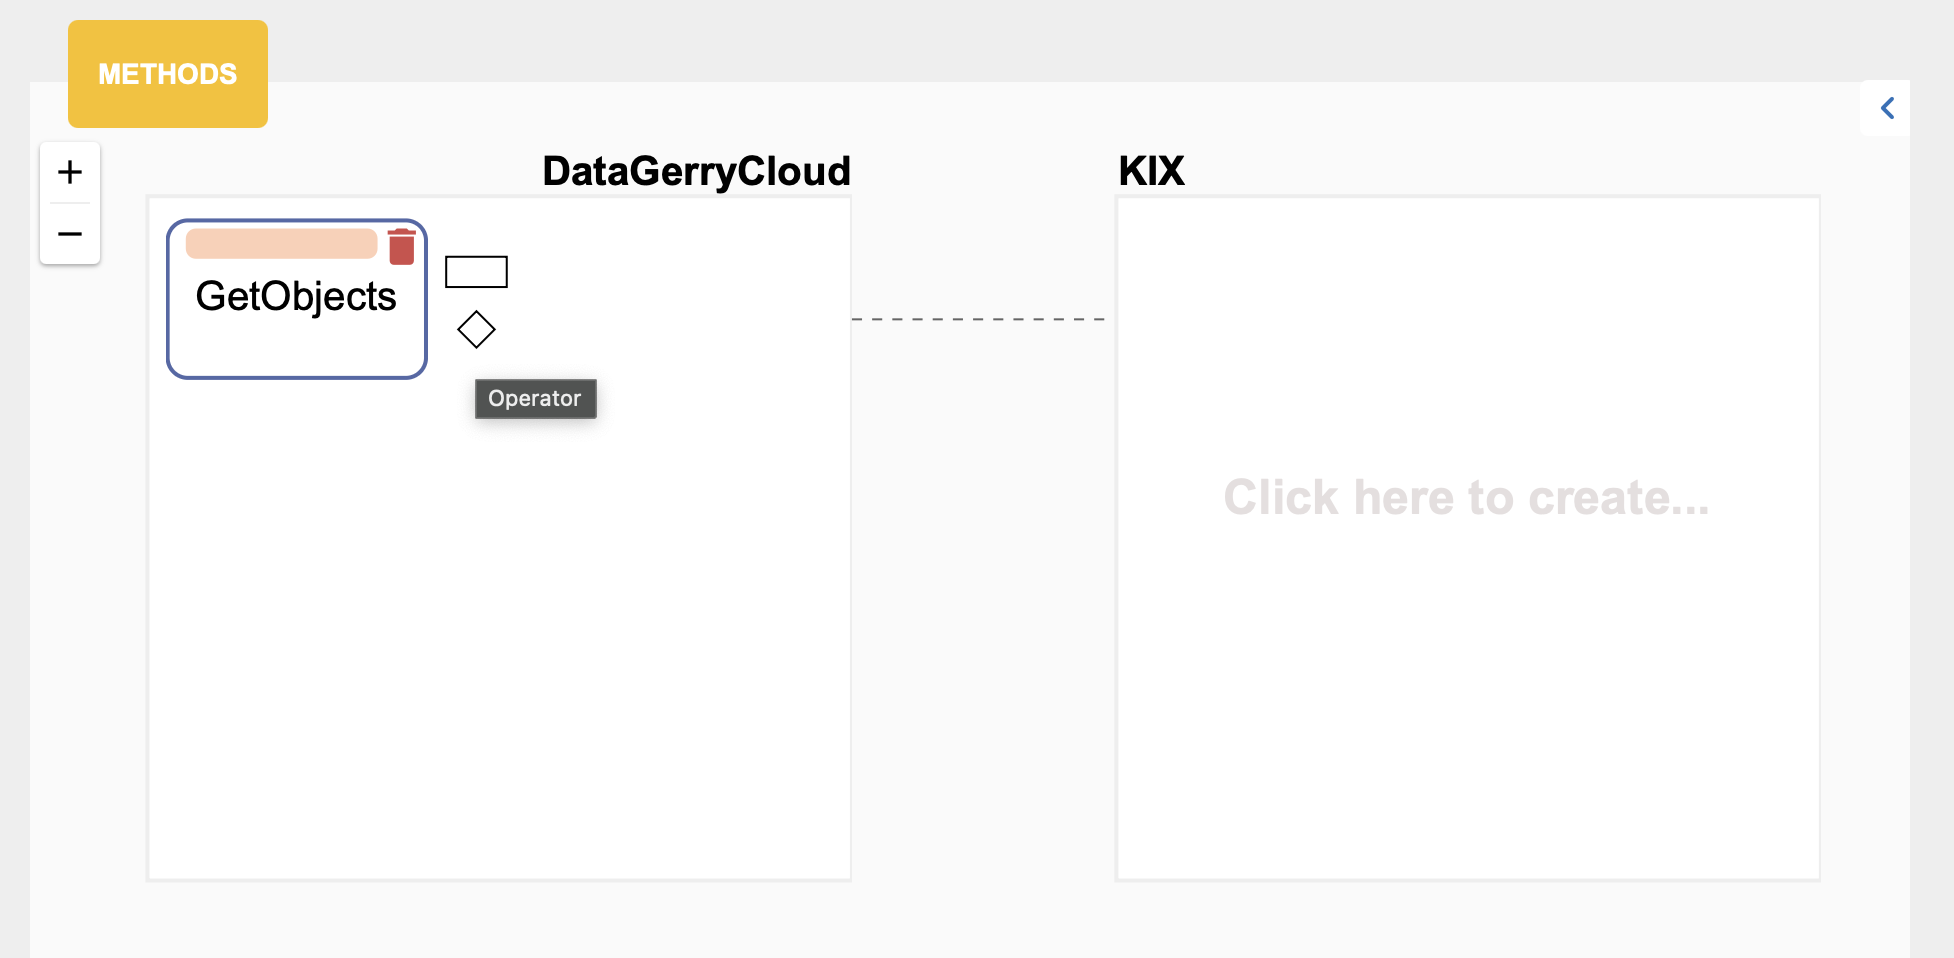
If methods or operators are already included, move the mouse over the method or operator to which you want to add a new method or operator. Corresponding symbols representing a new method or operator will then be displayed. Click on the desired symbol.
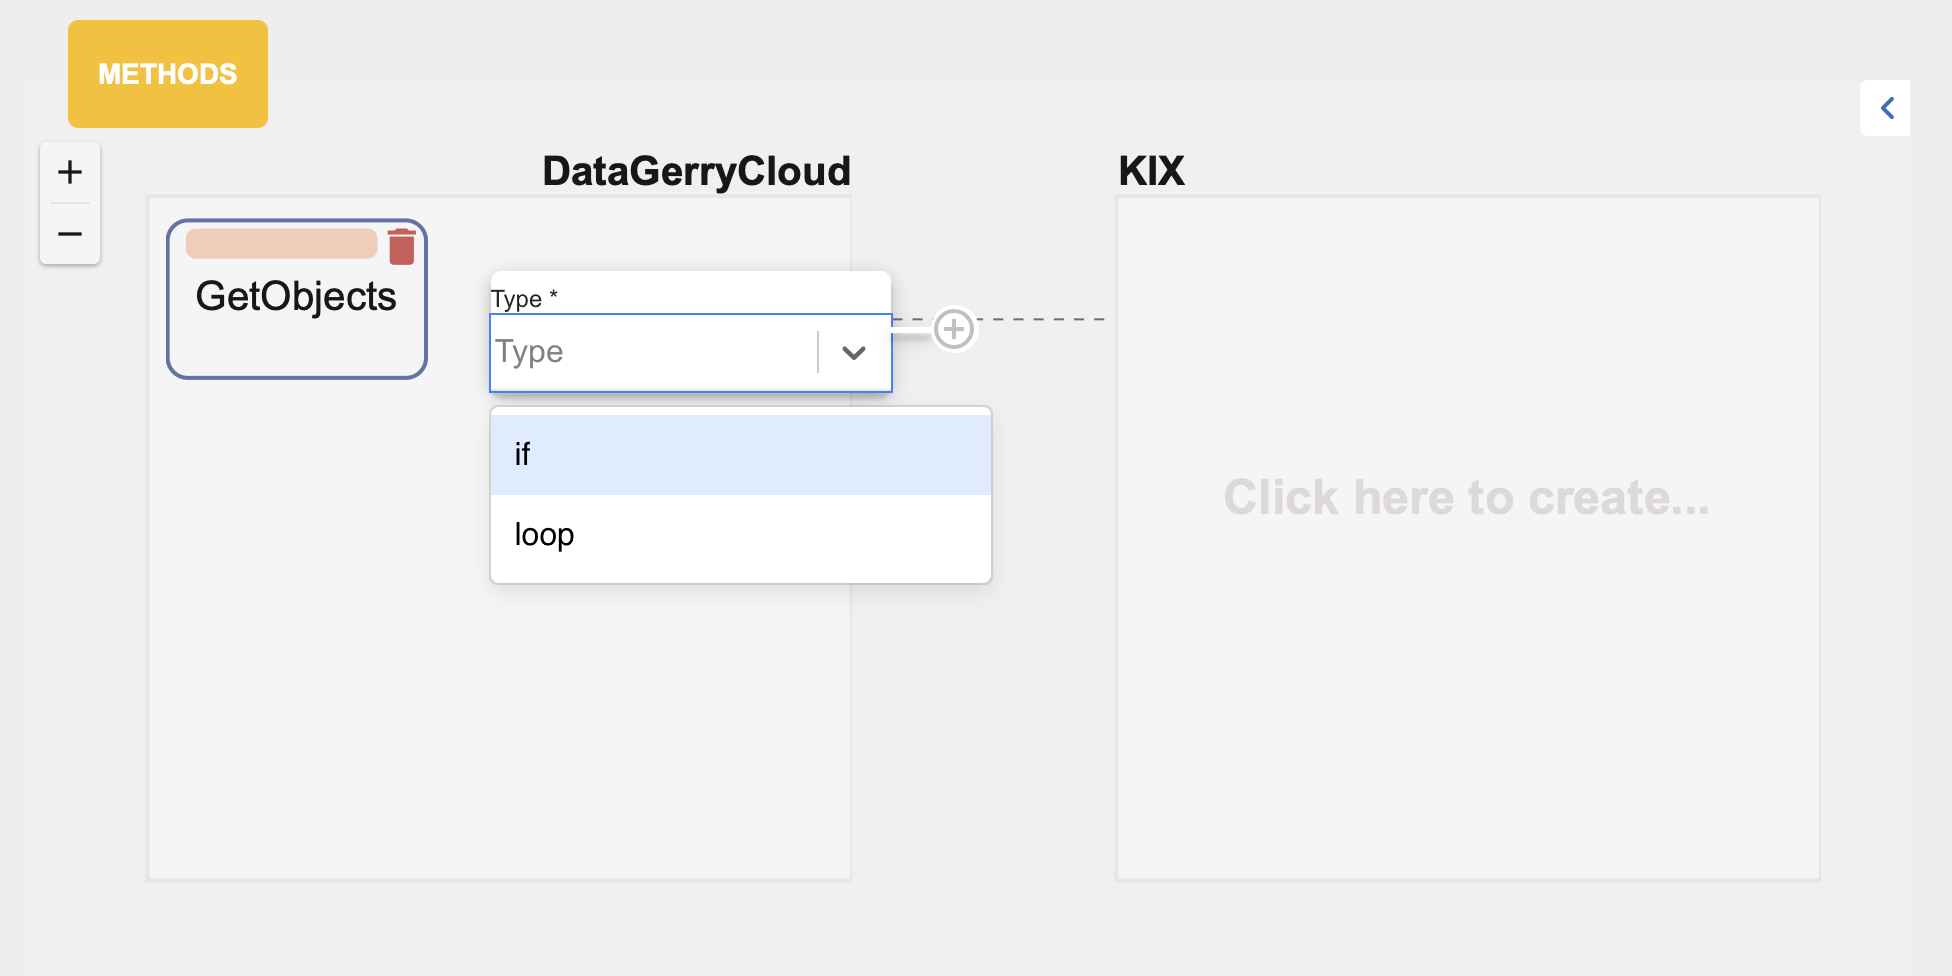
In the context menu, select whether it should be a loop or an IF operator. Confirm your selection by clicking on the plus sign. A new operator is added to the connection.
Defining the conditions of an If operator
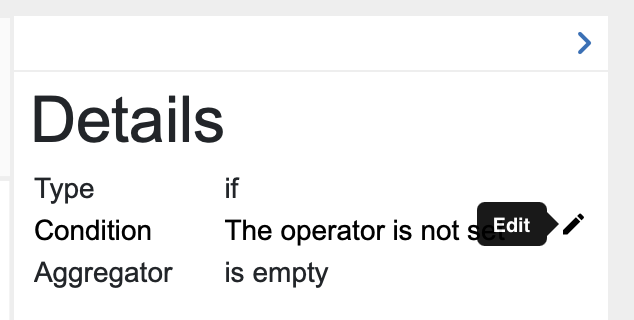
To edit the conditions of an operator, double-click on the operator to open the advanced operator view.
Alternatively, you can select the operator and click on the edit button for the conditions in the Details window.
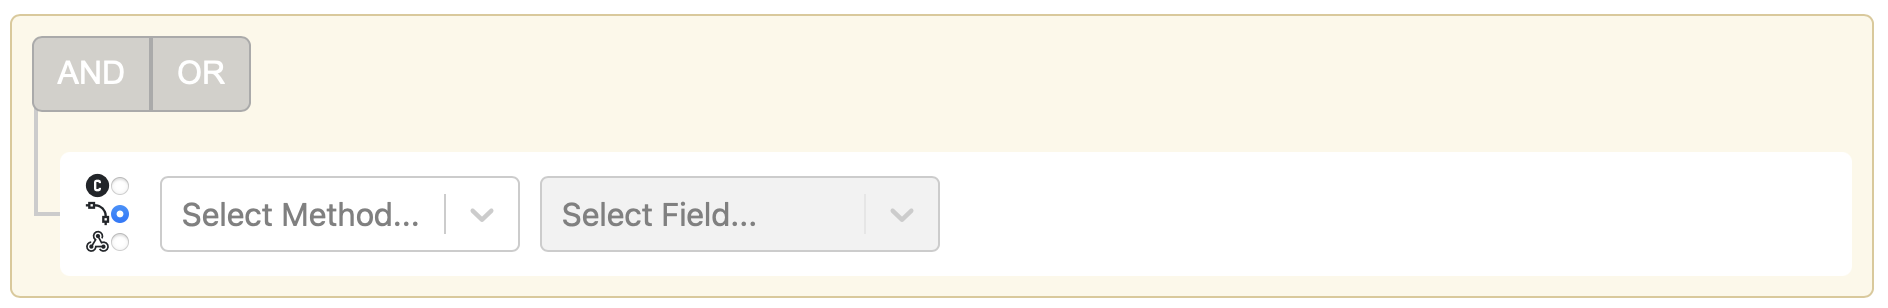
Move the mouse over the yellow area and select “Add Condition” or “Add Group.”
 or
or 
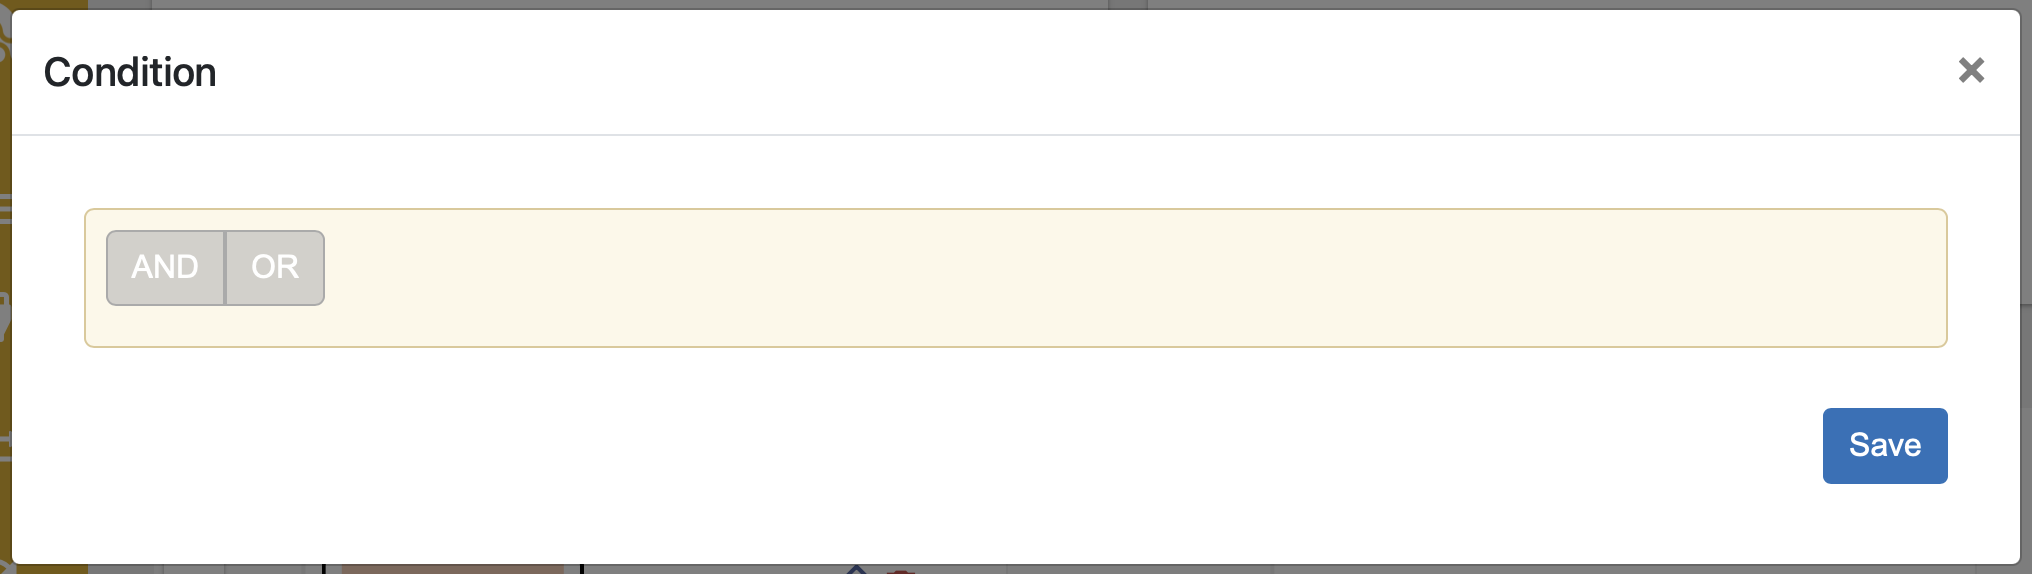
By adding one or more conditions and groups, which can be linked with AND or OR, it is possible to create very complex queries.
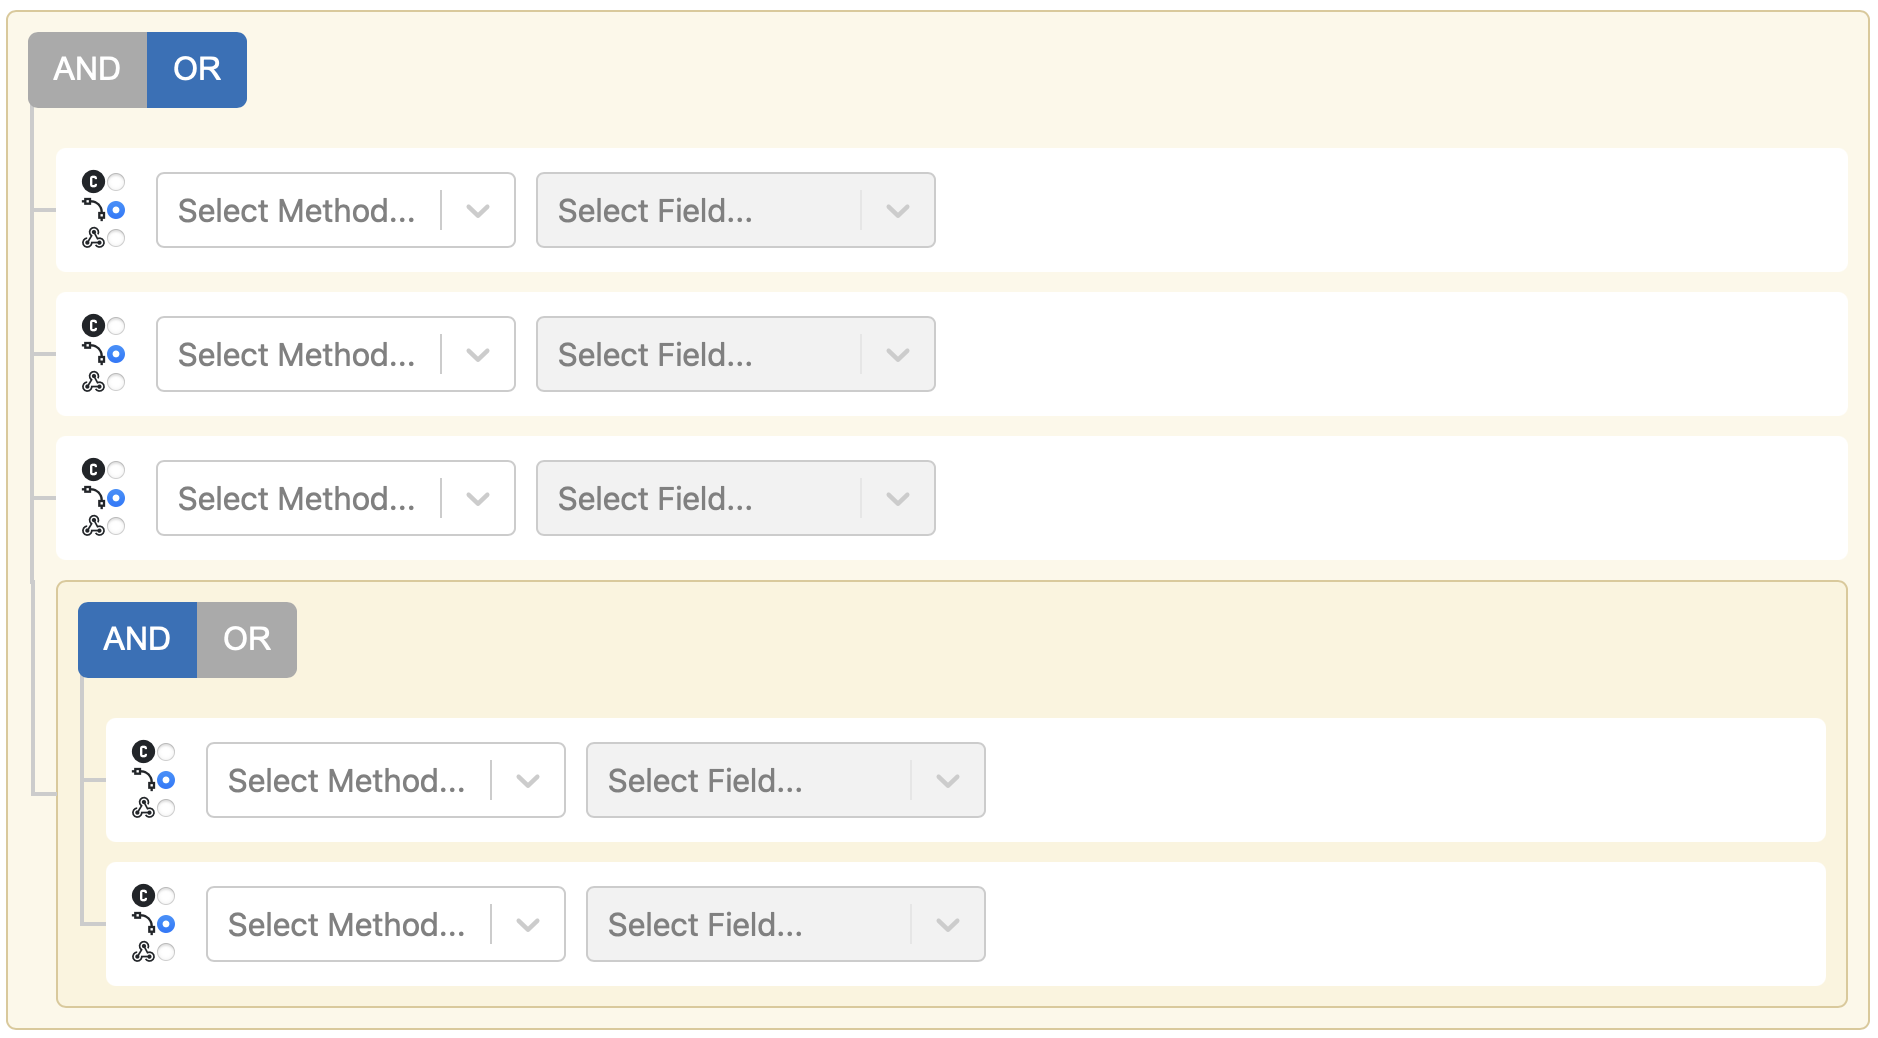
Once you have defined all conditions, click on the “Save” button to save the operator’s conditions and return to the connection editor.

Action Panel
On the bottom you can find the Action Panel.
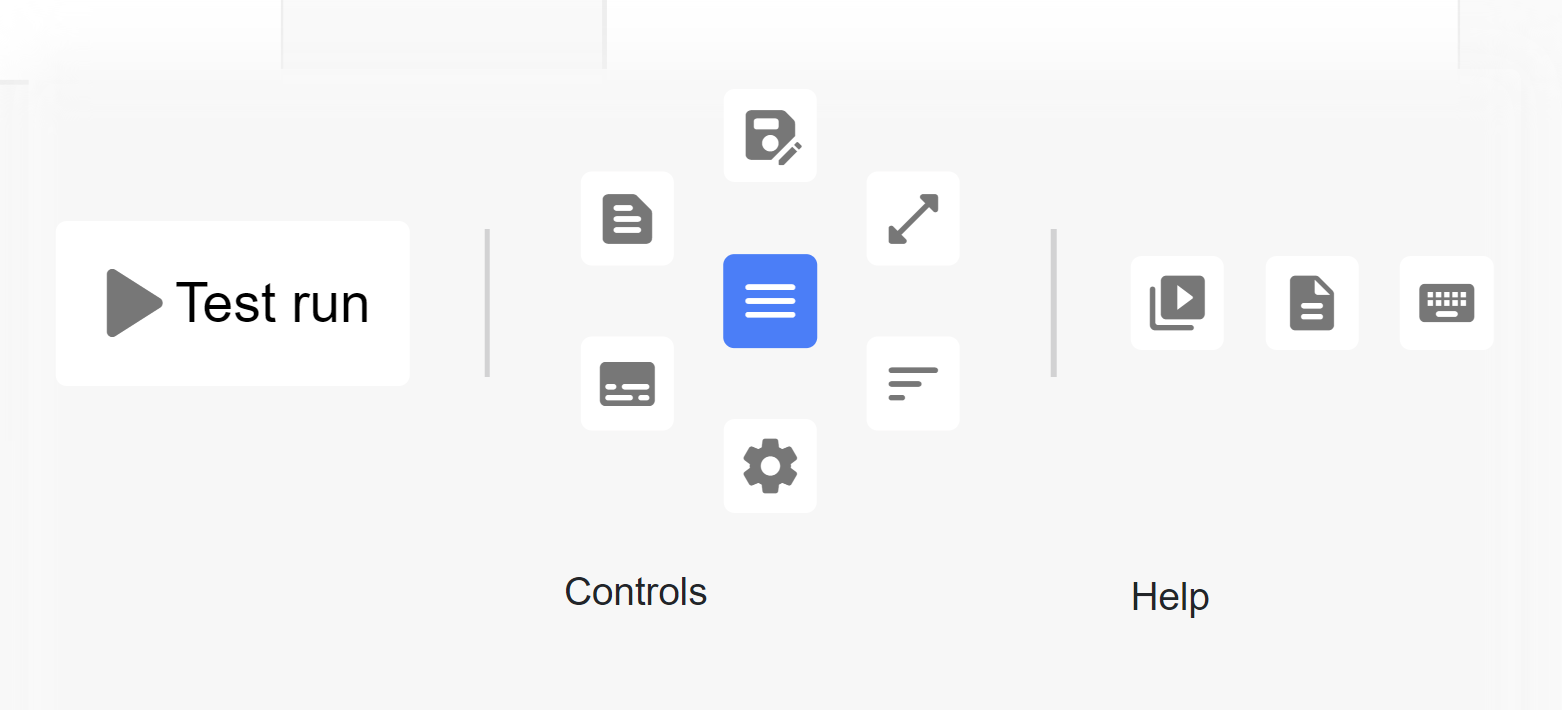
Here you can make most actions regarding to the connection:
 - testing the current connection creating a temporal connection and schedule.
 - saving options: save, save and close, save and go to add schedule (correspondingly
 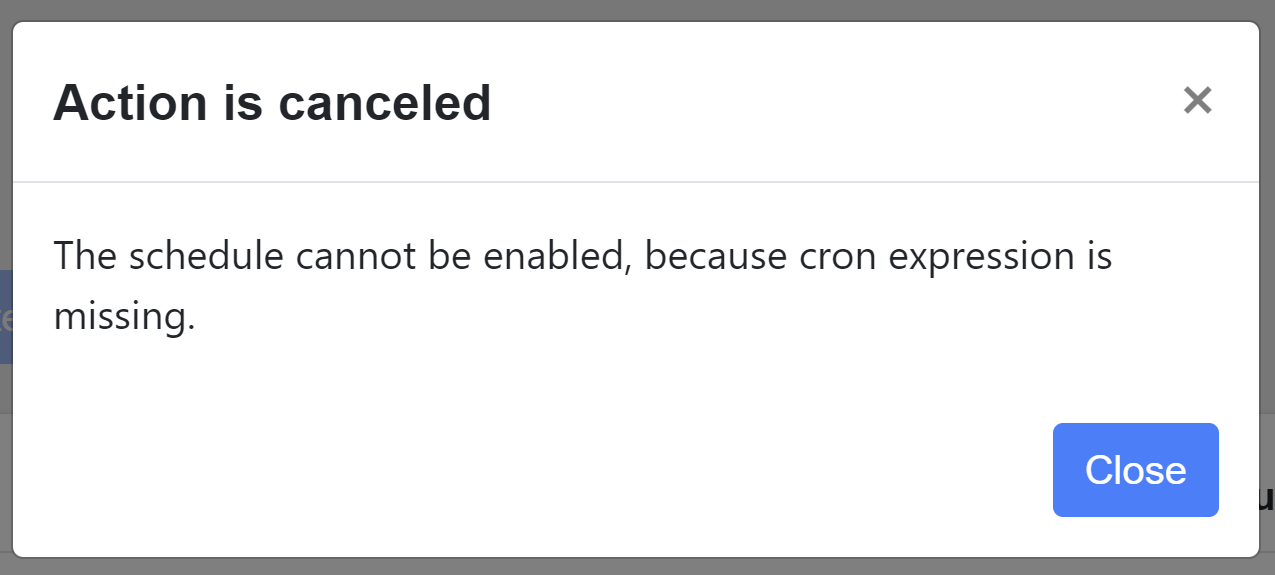 ).
).
 - resize the methods section to fullscreen and back.
 - toggle log panel that shows a test connection log messages.
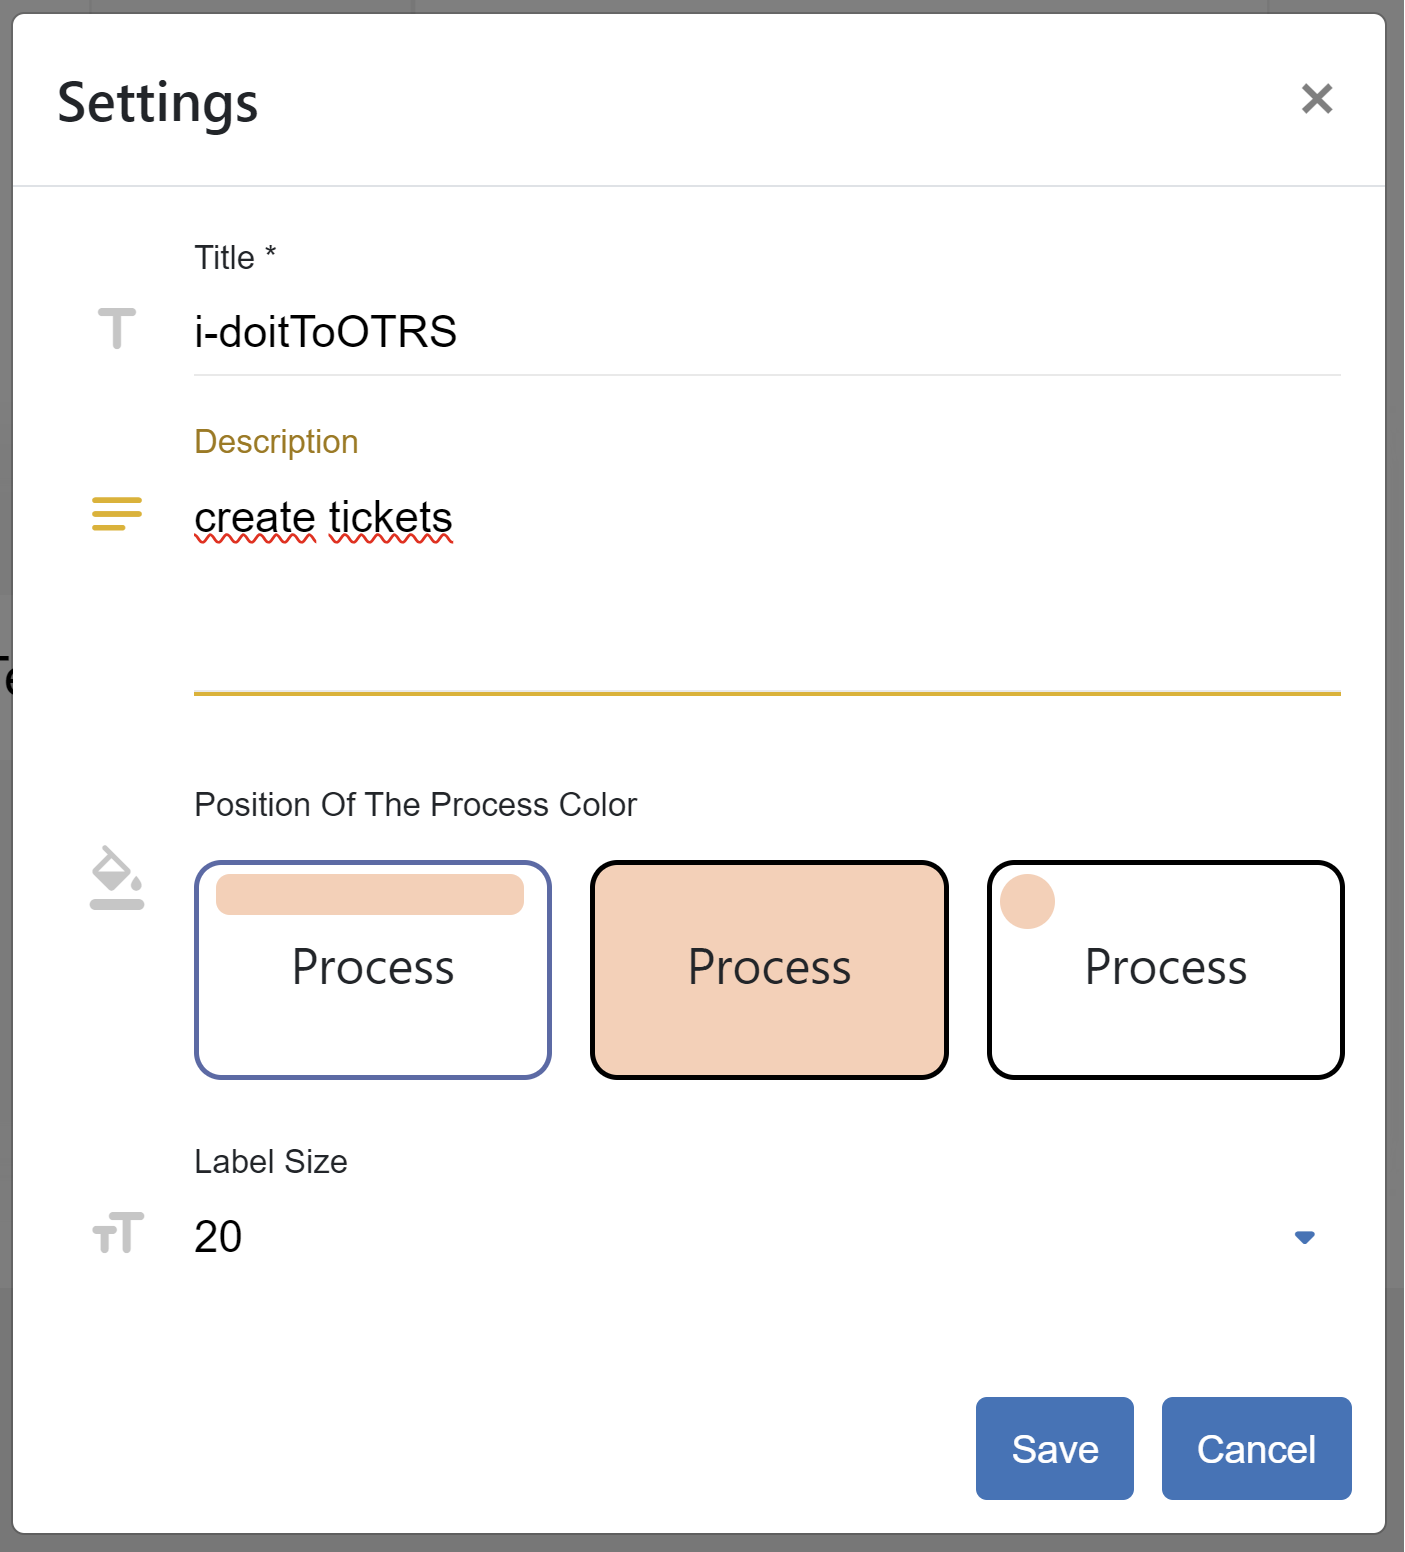
 - configuration that help you to set name and description in add/update connection form,
also you can set a color mode of the method and its name/label font size.
- configuration that help you to set name and description in add/update connection form,
also you can set a color mode of the method and its name/label font size.
 - toggle data aggregator:
 - template options: create a new template or load existing one (correspondingly
  ).
).
 - animation tool for explaining how to use the method section. It simulate the method’s editor
with the predefined data following with scripts that describe steps.
- animation tool for explaining how to use the method section. It simulate the method’s editor
with the predefined data following with scripts that describe steps.
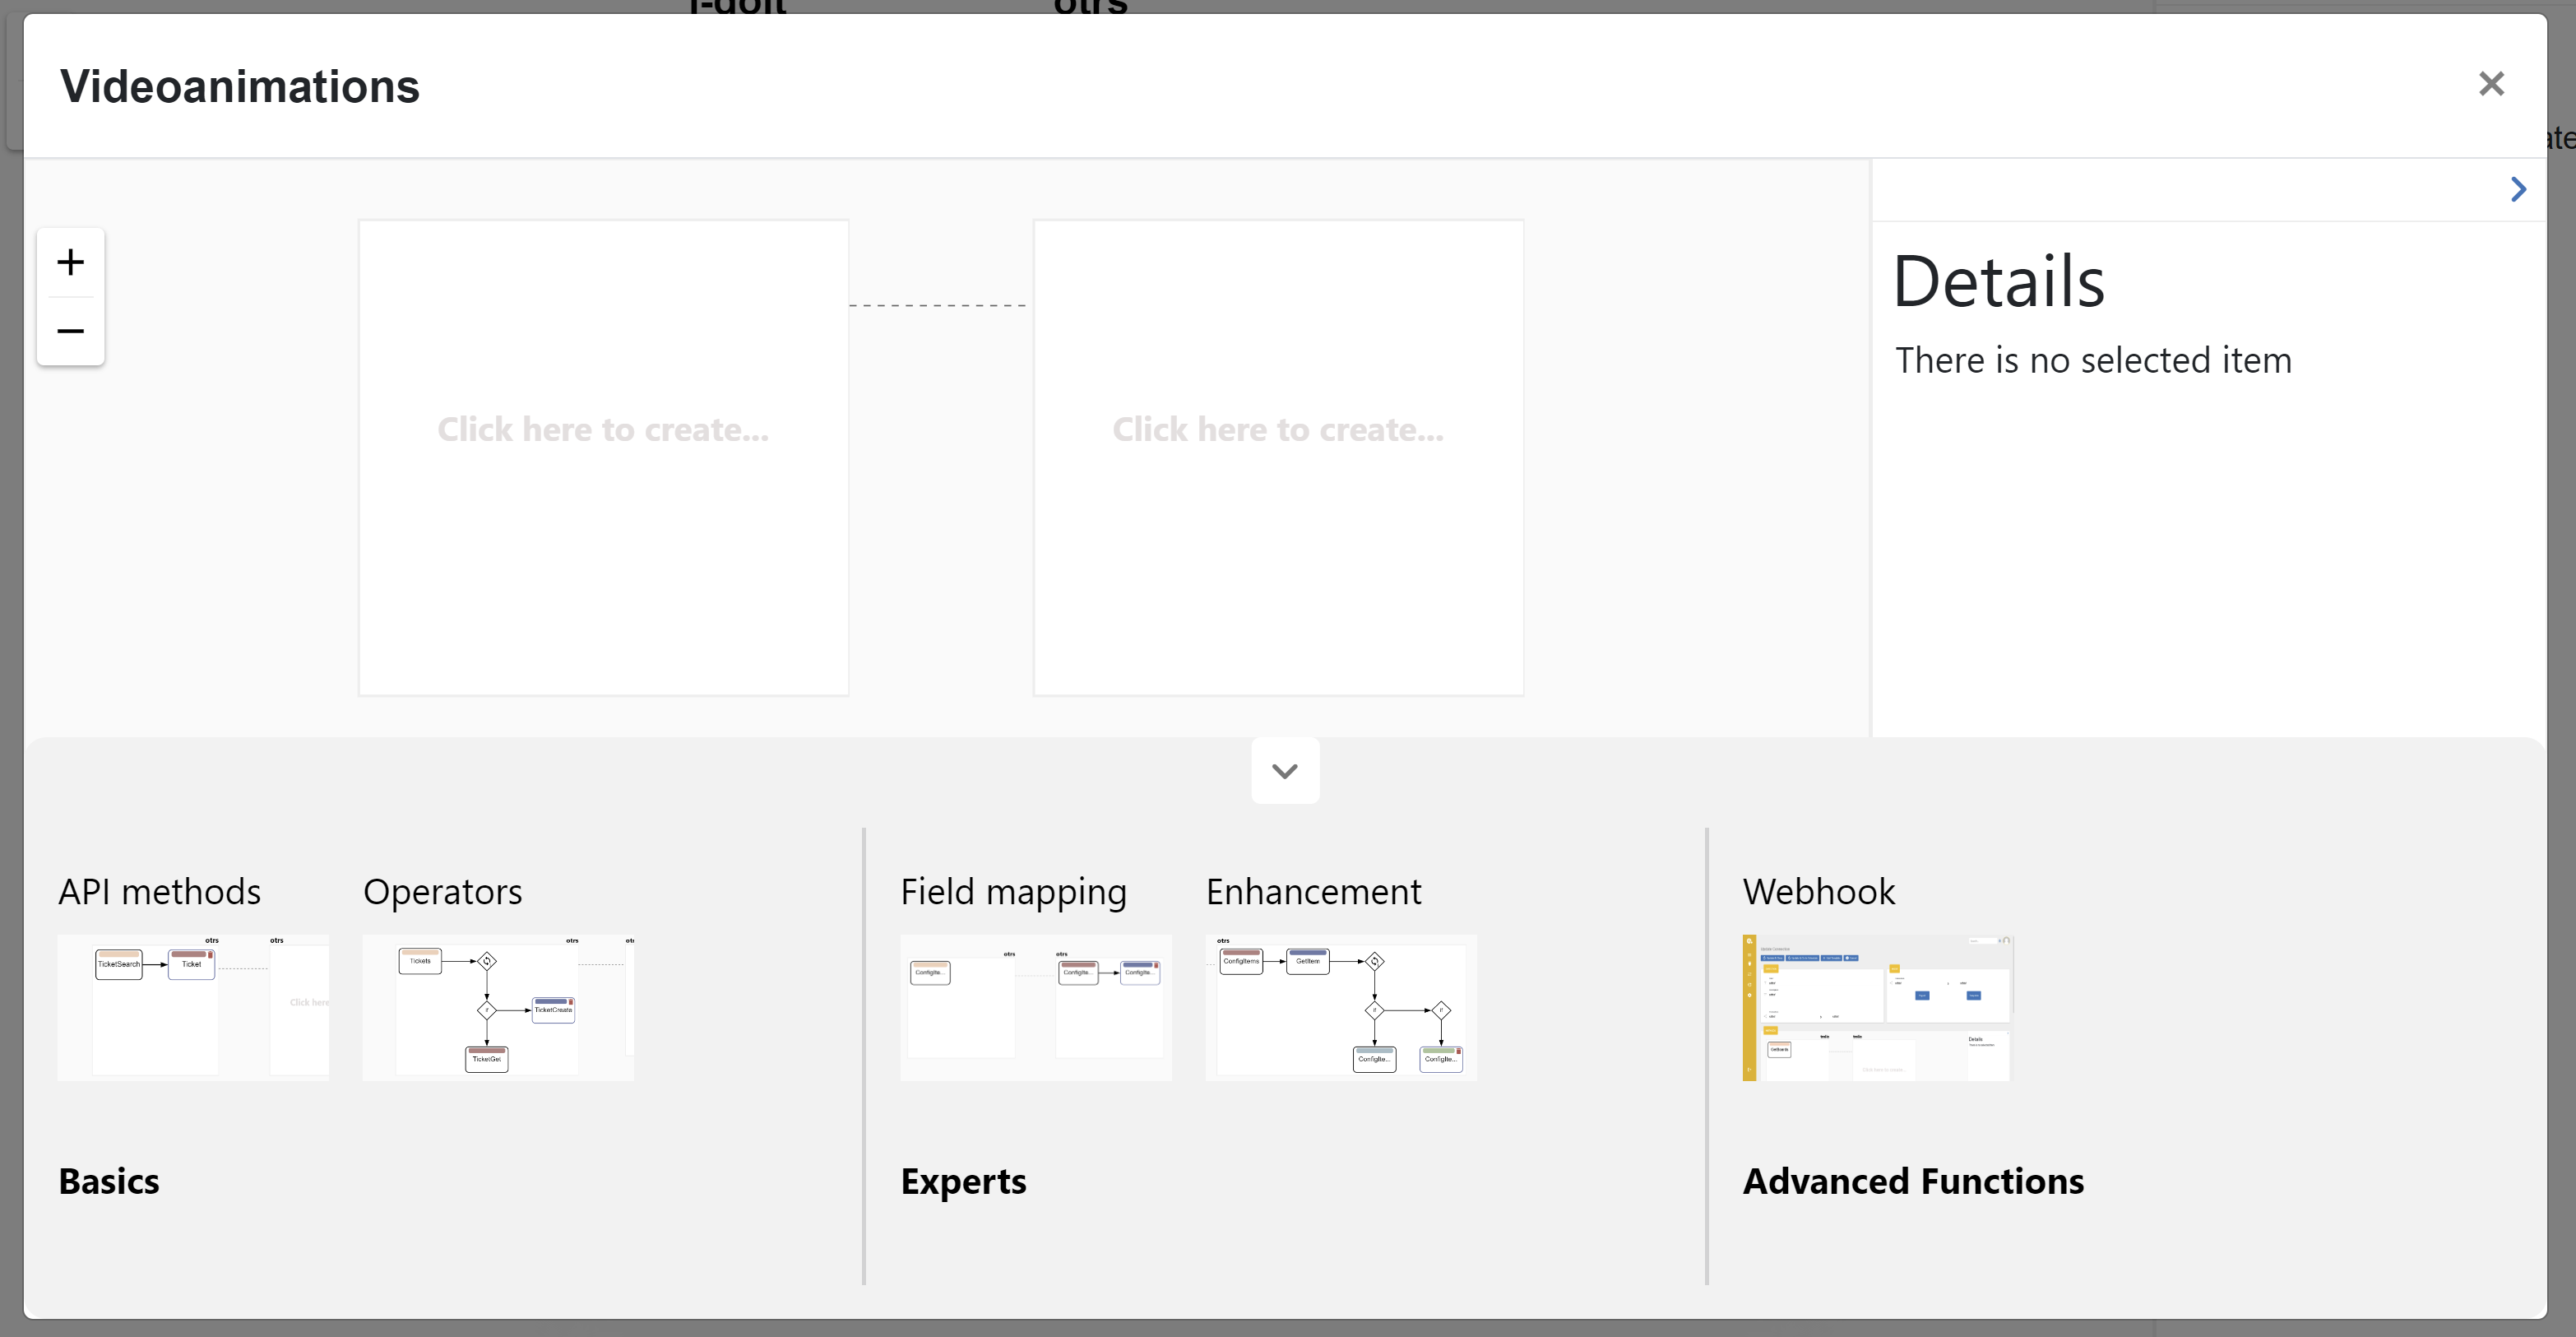
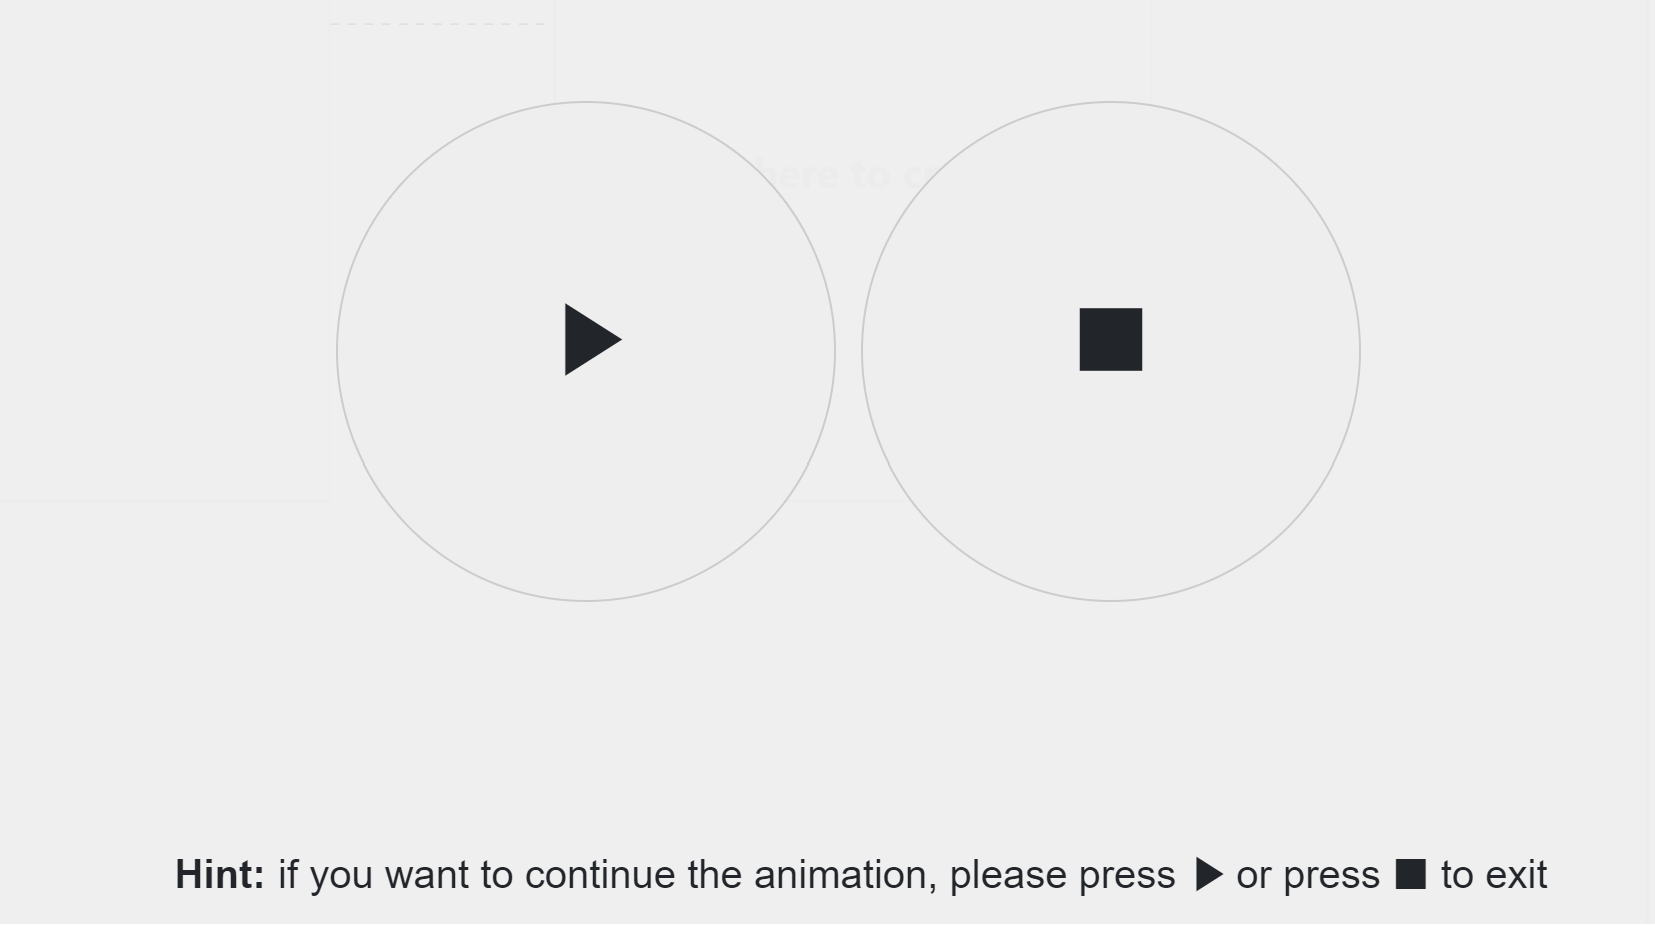
Just press on the required animation on the bottom and watch the simulation. On the right side you can see the panel where you can pause/play, increase speed or completely stop the simulation. During the animation you can not interact with it.

Only after stop, you can play with the connection by your own. Moving your mouse on the center or clicking on any place you can see the pause/play/stop icons.
 - synchronize invokers. Sometimes you need to change the invoker file manually. The connection
that uses these invokers will not update them automatically, because for some cases it is not needed.
That is why you can sync by your own using this feature.
- synchronize invokers. Sometimes you need to change the invoker file manually. The connection
that uses these invokers will not update them automatically, because for some cases it is not needed.
That is why you can sync by your own using this feature.
 - shortcuts
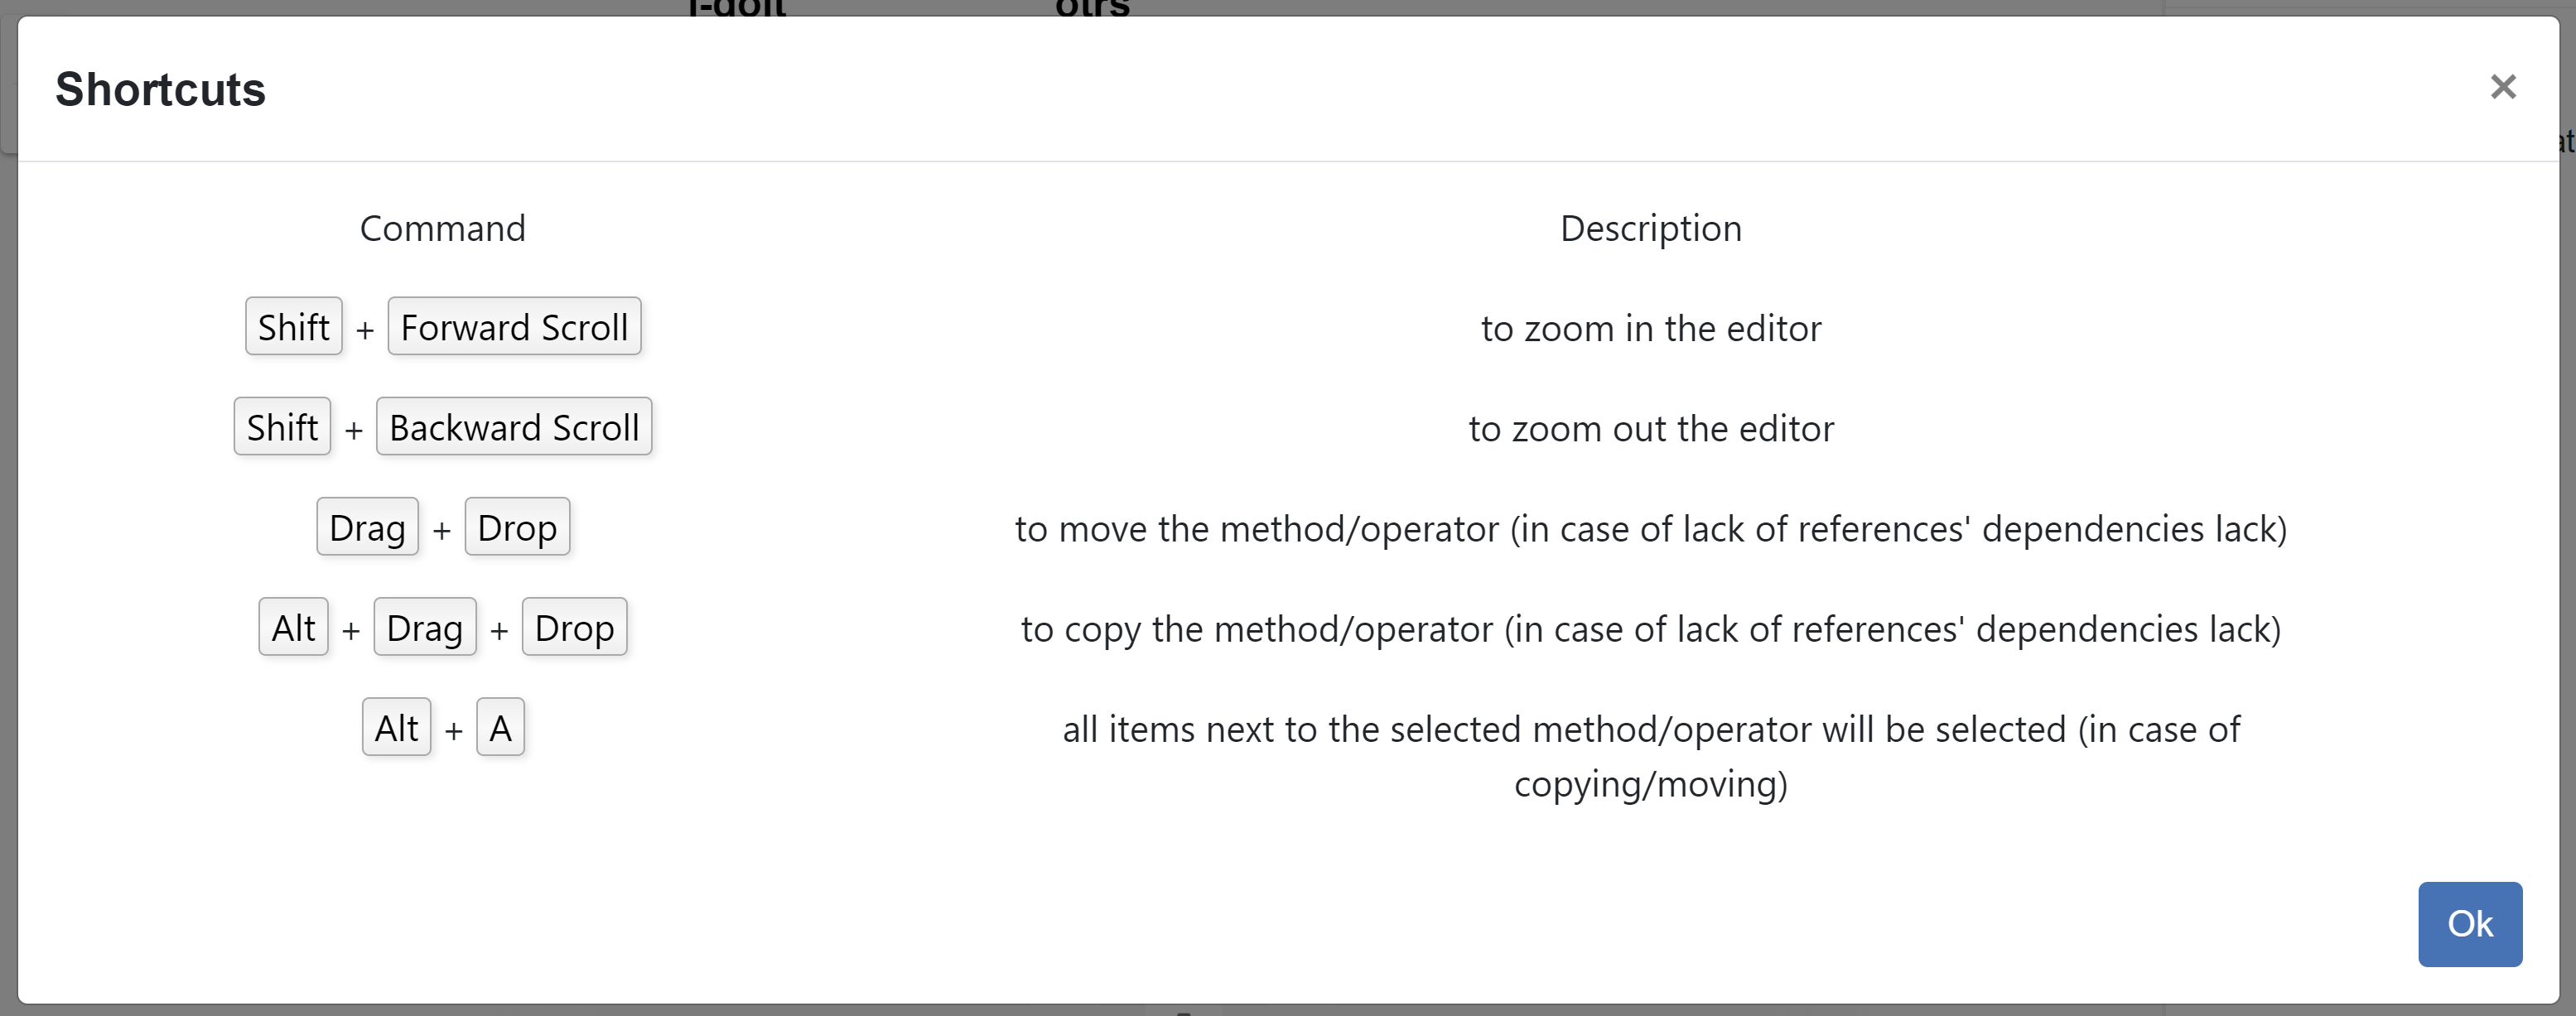
On the left side in the methods section you can see the zoom in and zoom out actions
Create Reference
There is a possibility to add a parameter into the Endpoint (except the first method in from connector). This parameter is a reference to the response of the previously created method.
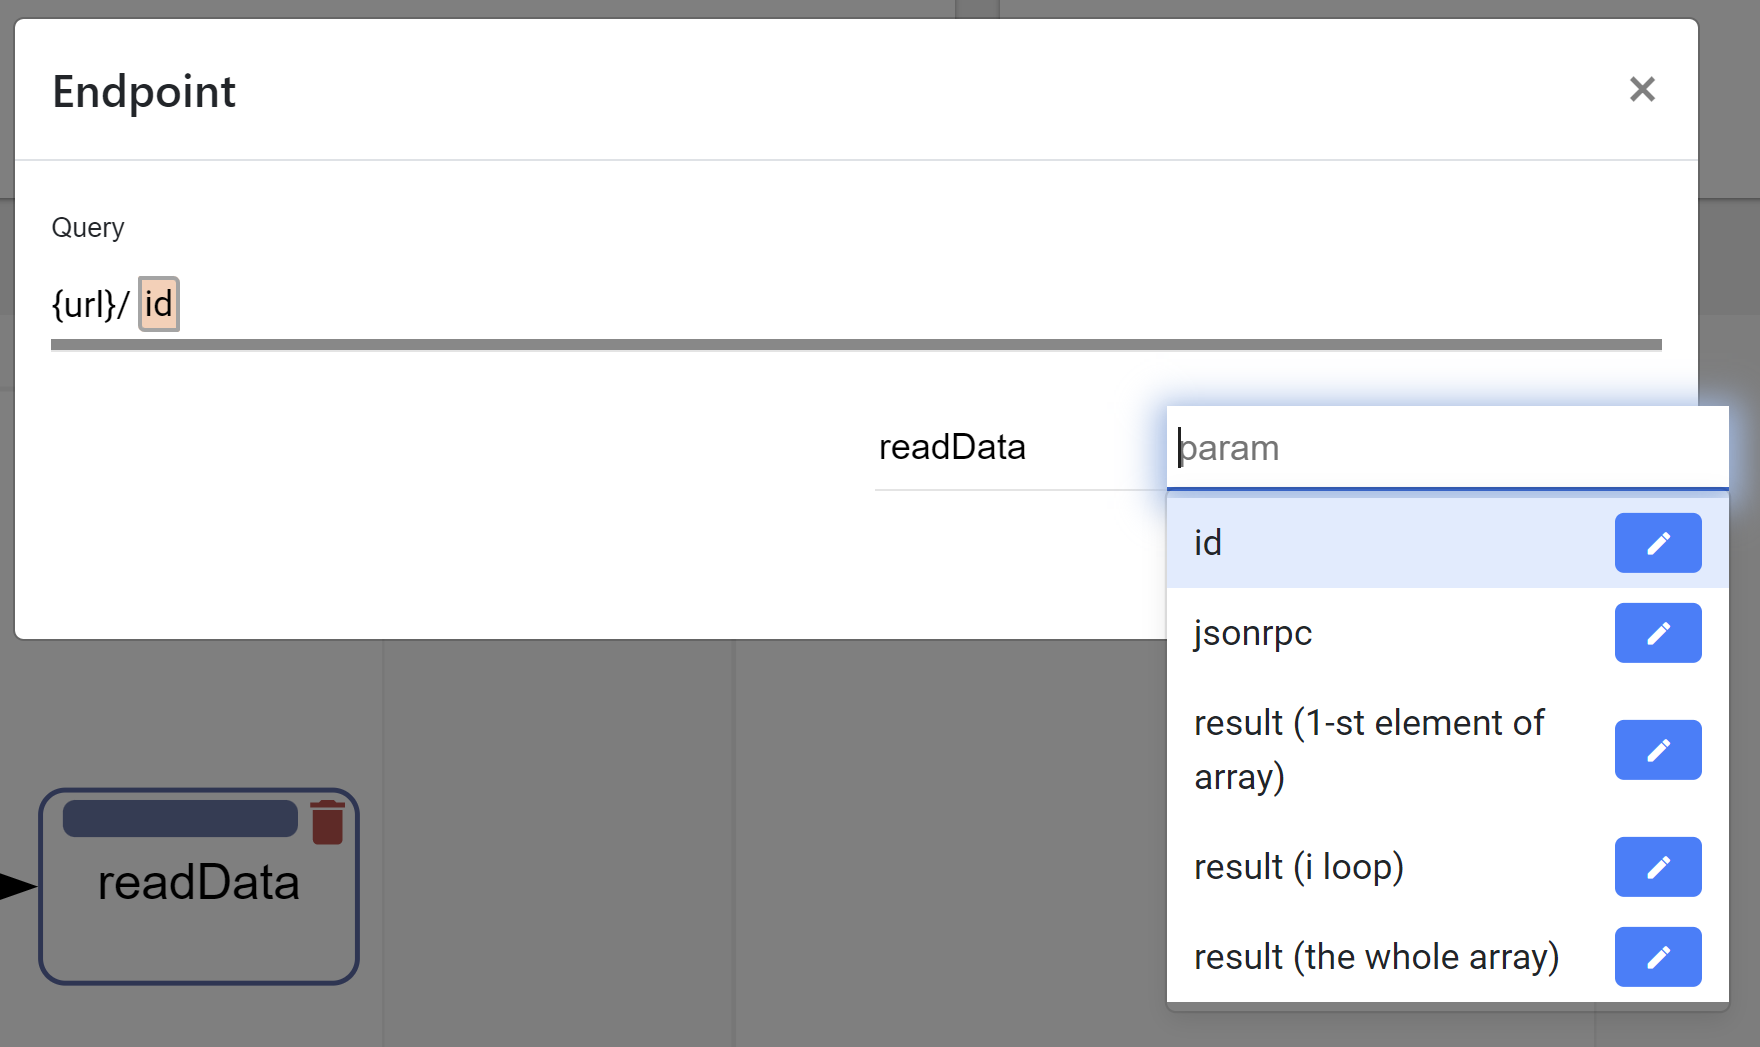
If the response is in json format and array, then you can choose the whole array or only a specific element in the array typing [arrayIndex]. It means to take the element with the specified index. To choose the whole array you need to type [*]. If the response is in xml format then you can also reference to the attribute of the xml tag. Just type @ and if the xml tag has attributes they will be popped up and you can select one. You choose method, fill out the parameter and click plus button. The parameter comes from the invoker. If it exists there, you will see it after typing the third symbol in the input field as a select popup block.
Body can also contain references from the previous methods. Select reference icon
 to open the reference generator.
You can handle with that in the same principe as for the Query.
When you finish with editing click on the apply icon  .
.
Moreover, you can add an enhancement between fields. Clicking on the reference
Note
Enhancement is currently only supported in the body configuration of the target system (to connector).
you will see a popup window where you set a description and an enhancement itself.
The enhancement is a piece of code that is processed during the execution of the connection. It helps to define the payload properties using references and applied code. Right now, we support JavaScript code (engine behind it: org.openjdk.nashorn:nashorn-core 15.4)
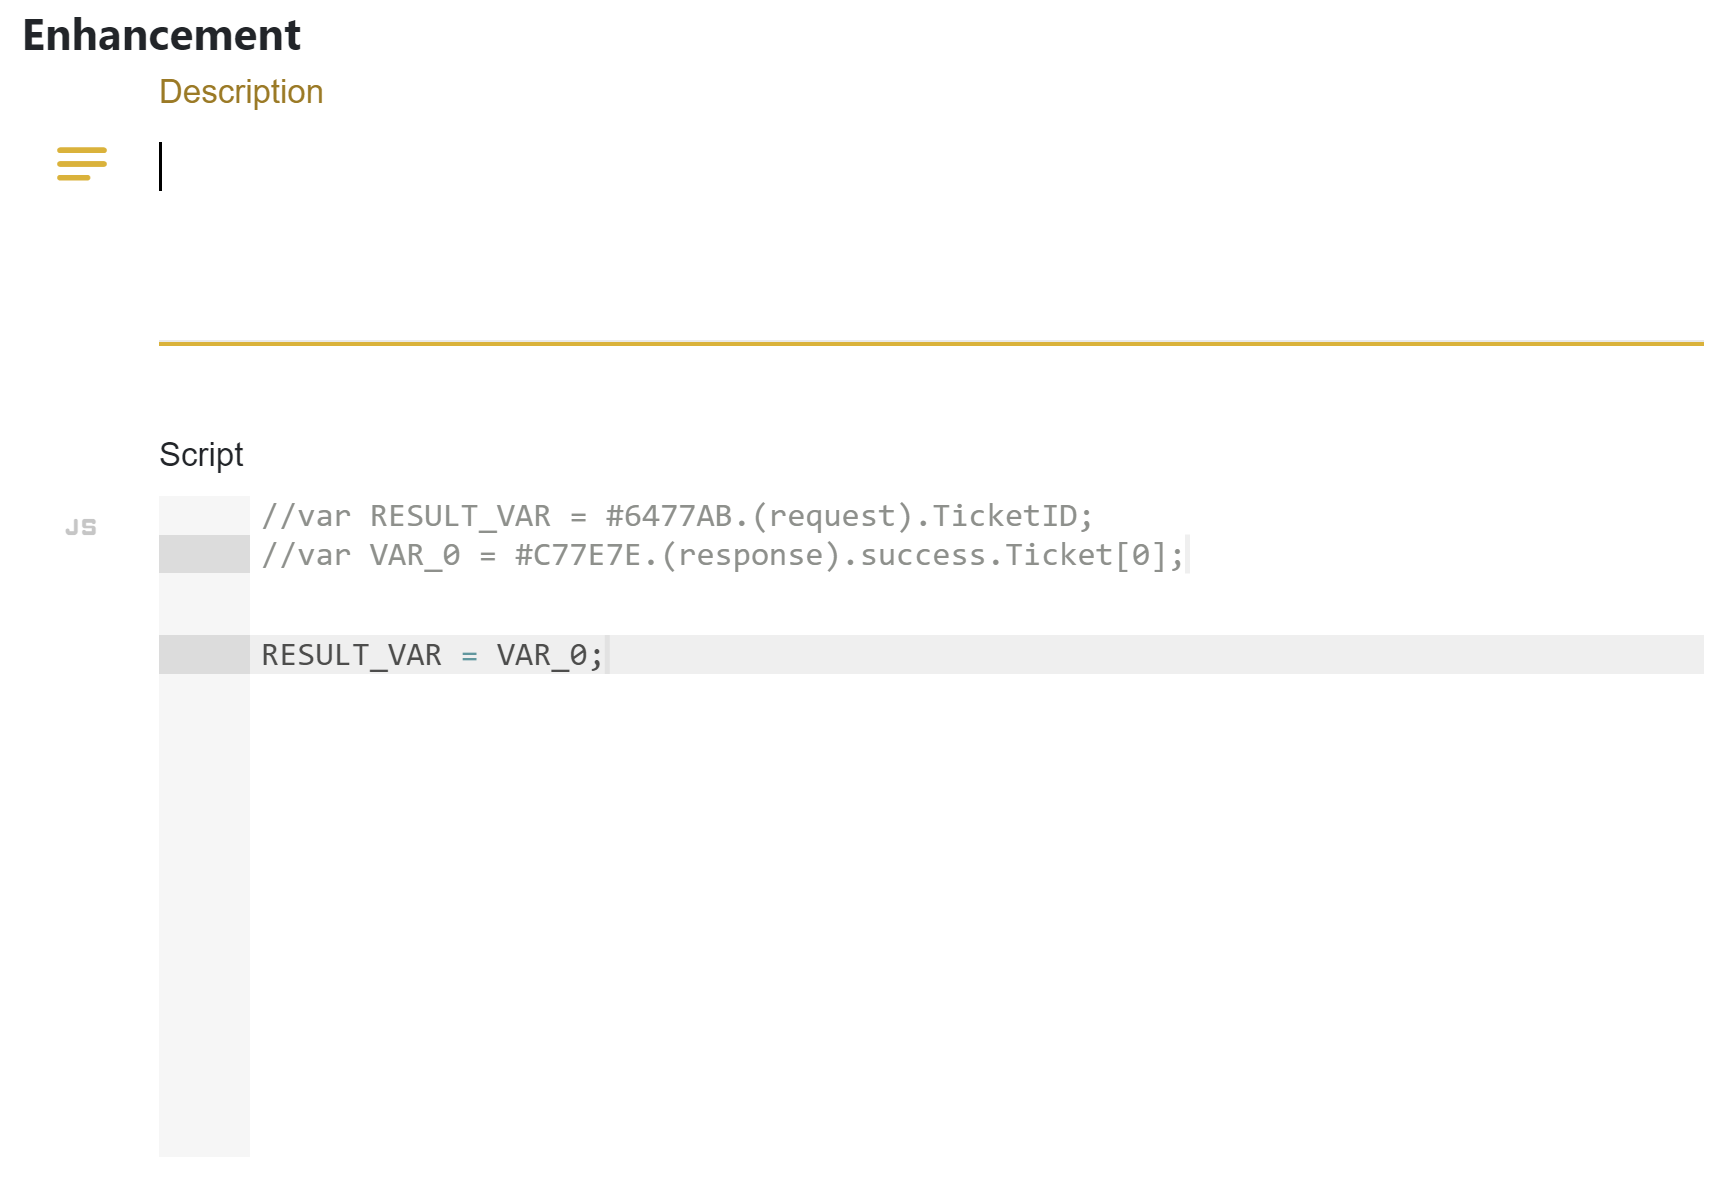
There are predefined variables to relate with the fields. VAR_[i] are coming parameters and RESULT_VAR is the final value for to connector field.
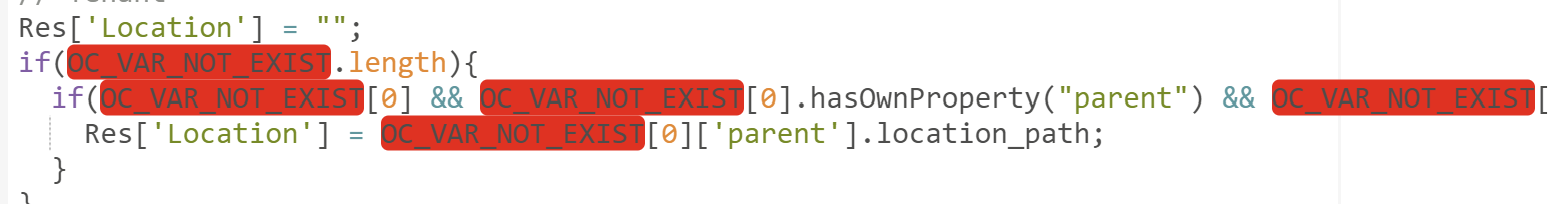
The reference could be easily deleted if you mouse over it and click on the delete icon  .
All variables related to this references will be automatically replaced on OC_VAR_NOT_EXIST in the enhancement’s script.
.
All variables related to this references will be automatically replaced on OC_VAR_NOT_EXIST in the enhancement’s script.
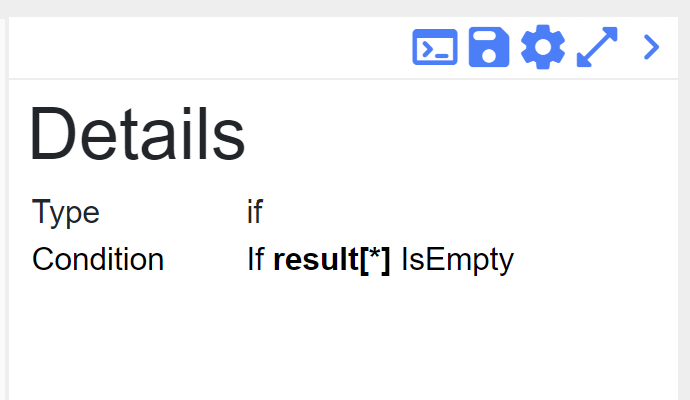
When you create an operator there are two options: if and loop. if operator does a condition before performance. You should define here also a reference, choose a condition operation and set with what are you doing to compare.
loop operator makes request in the loop under conditions that you define.
As you can mention, all items under the operators are shifted on the level down. Selecting the operator you will see the scope of their influence.
Create Webhook
The connection editor provides an opportunity to use webhook parameters inside of the connection.
If you want to deliver query parameters (using GET) or payload (POST), you need to click on the
reference icon in body of the method and select the webhook option. Here you will see the list of existing
webhook parameters in the connection and a possibility to create a new one.
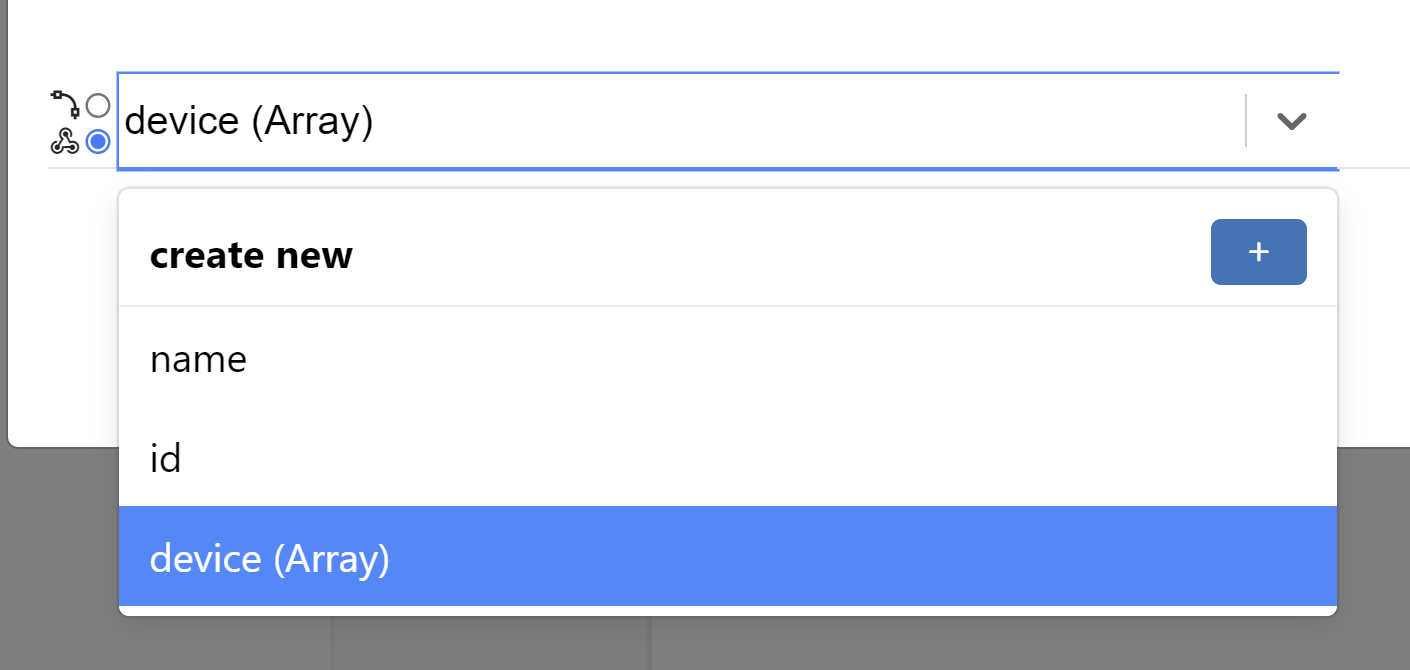
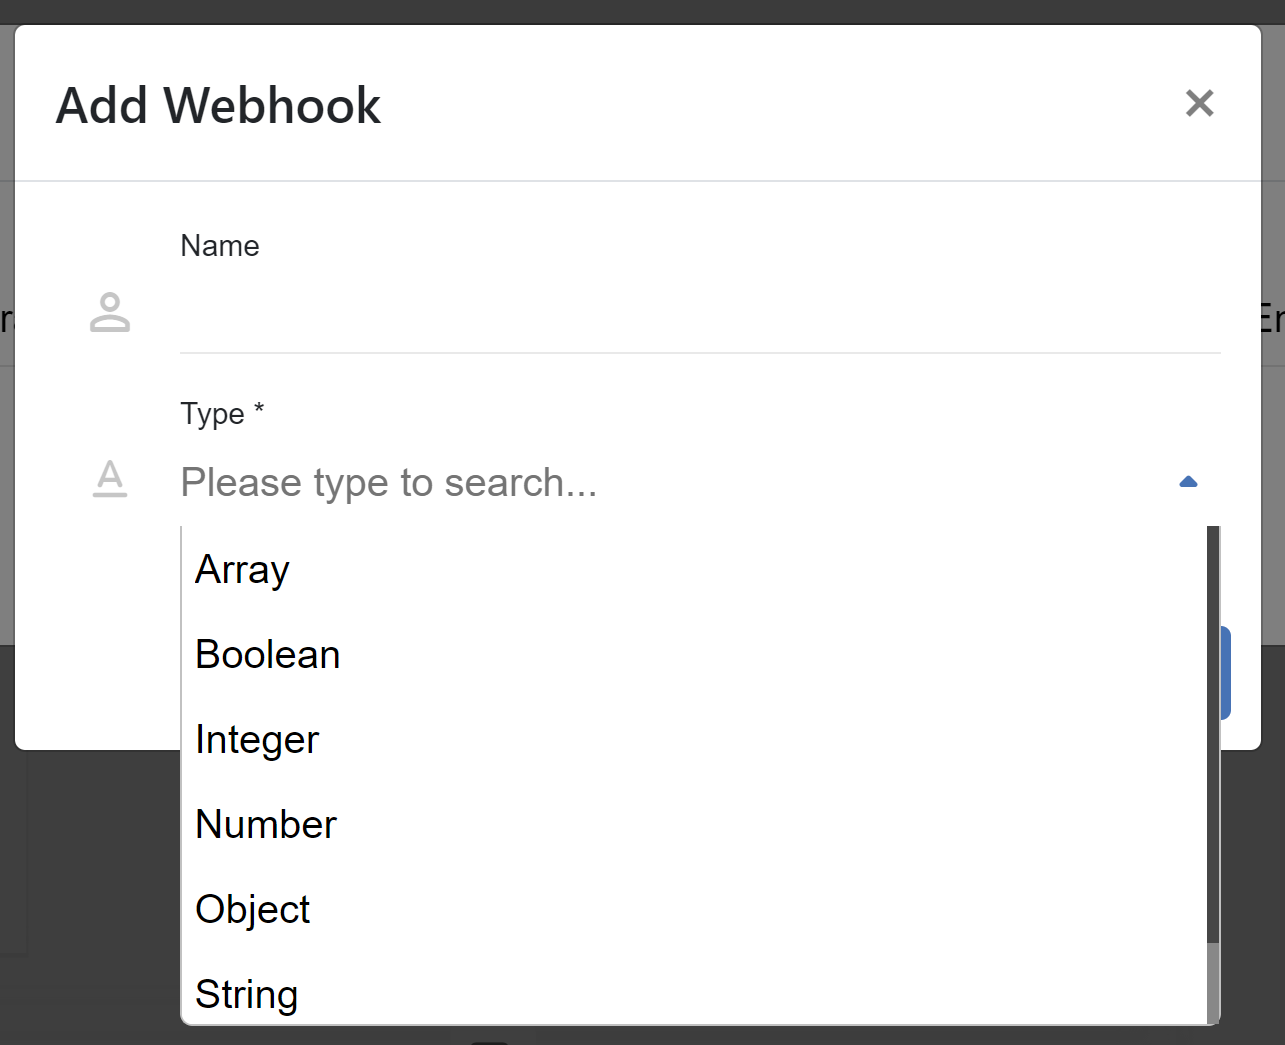
When you click on the plus icon, a dialog will pop up where you need to enter the name of the parameter and choose its type. There are next existed types:
ArrayBooleanIntegerNumberObjectStringUndefined
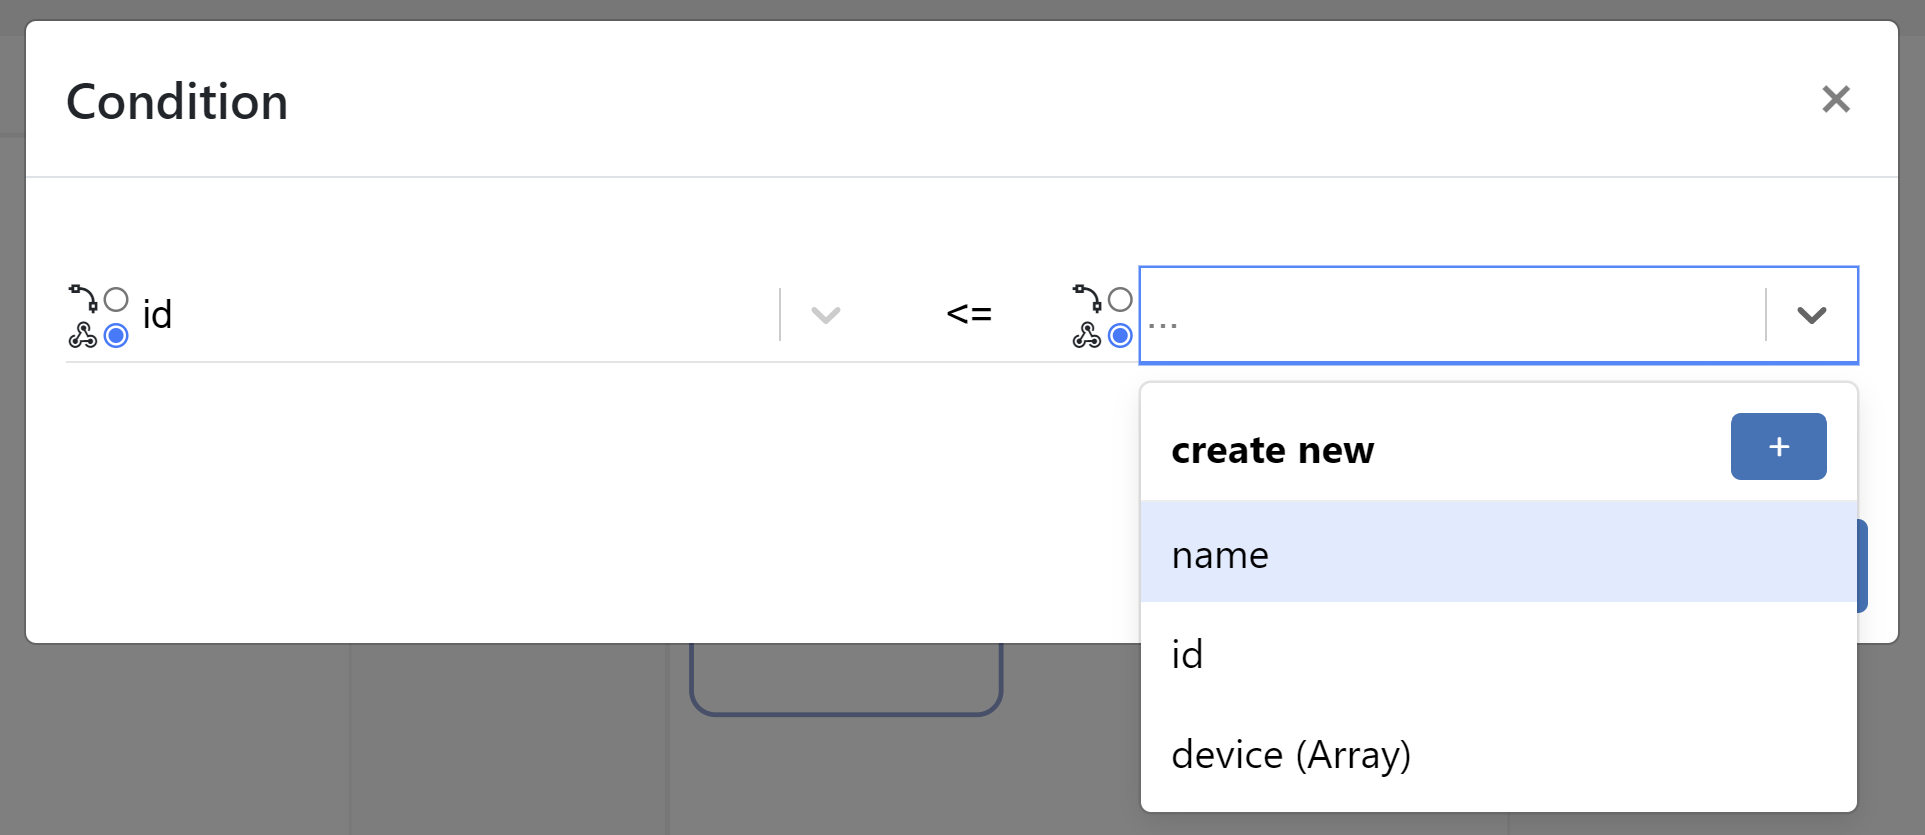
The webhook is also could be used in operators. For IF operator you can apply it on both sides.
If the process is located inside of the loop, your webhook parameter can also go throw it. You just need to add [iterator] in the end of the parameter.
Example:
You have a loop operator with i iterator and you want to have a webhook reference on parameter
result and go throw it. Then your webhook parameter will look like that: result[i].
Or if you want to take just the first element of the array: result[1].
The webhook parameters can also be used in endpoints. Right now, there is no UI for this (coming in
next version), so you need to add it manually. It has the next format: ${[name]:[type]}
Example:
You have the endpoint: {url}/api/ and you want to add the webhook parameter methodName with type string
it will be: {url}/api/${methodName:string}
Pagination
Some APIs fetch data with pagination. You define the amount of data and specific page so the system responses with a bunch of data. To make clear for the connection how much data should it handle, you need to describe the pagination inside of the invoker file. There is a new xml-tag on the same level with authType or operations - pagination.
Pagination parameters:
LINK- contains url that fetches next data.SIZE- total number of elements.PAGE- refers to a page number. Will be incremented to one.LIMIT- number of elements that should be fetched at a timeOFFSET- refers to the starting point from which data should be retrieved and incremented to LIMITRESULT- includes an array of elements retrieved from the response.HAS_MORE- signifies that the array contains elements which require retrieval.CURSOR- utilizes a pointer that refers to a specific database record.ORDER- defines in which sequence elements are organised (asc, desc).
Parameter actions:
READ- Specifies that the value of the property should be retrieved from the specified path in the reference.WRITE- Specifies that the value of the parameter should be placed at the specified path in the reference.INCREMENT- Specifies that the value of the parameter should be added and then increased. Used for OFFSETCOLLECT- Specifies that elements from the responses should be aggregated into a single list. Used for RESULTFETCH. - Specifies the subsequent data to be retrieved. Used for LINK.
Parameter reference examples:
response.body.$.param1.param2 - points to a parameter in the RESPONSE BODY.
request.body.$.param1.param2 - points to a parameter in the REQUEST BODY.
response.header.$.param1. - points to a parameter in the REQUEST HEADER.
request.url.$.param1.param2 - points to a nested parameter within the REQUEST URL.
EXAMPLES:
Example for OFFSET-LIMIT pagination:
Pagination:
<pagination>
    <limit ref="request.url.$.limit" action="write">5</limit>
    <result ref="response.body.$.items" action="collect"/>
    <offset action="increment">0</offset>
    <size ref="response.body.$.total" action="read"/>
</pagination>
Request:
<request>
    <method>GET</method>
    <endpoint>{url}/offset/example?offset=@{offset}</endpoint>
    <body/>
    <header>
        <item name="Authorization" type="string">{basic}</item>
        <item name="Content-Type" type="string">application/json</item>
    </header>
</request>
Response:
<body type="object" format="json" data="raw">
    <field name="items" type="array">
        <field name="id" type="string"/>
        <field name="name" type="string"/>
        <field name="username" type="string"/>
    </field>
    <field name="nextCursor" type="string"/>
    <field name="nextLink" type="string"/>
    <field name="forin" type="string"/>
    <field name="total" type="string"/>
    <field name="offset" type="string"/>
    <field name="limit" type="string"/>
</body>
Example for PAGE-BASED pagination:
Pagination:
<pagination>
    <limit>5</limit>
    <result ref="response.body.$.content" action="collect"/>
    <page action="increment">0</page>
    <size ref="response.body.$.totalElements" action="read"/>
</pagination>
Request:
<request>
<method>GET</method>
<endpoint>{url}/page/example?size=@{limit}&page=@{page}</endpoint>
<body/>
<header>
<item name="Authorization" type="string">{basic}</item>
<item name="Content-Type" type="string">application/json</item>
</header>
</request>
Response:
<body type="object" format="json" data="raw">
    <field name="content" type="array">
        <field name="id" type="string"/>
        <field name="name" type="string"/>
        <field name="username" type="string"/>
    </field>
    <field name="totalElements" type="number"/>
</body>
Example for CURSOR-BASED pagination with a LINK:
Pagination:
<pagination>
    <limit>5</limit>
    <result ref="response.body.$.items" action="collect"/>
    <link ref="response.body.$.nextLink"/>
</pagination>
Request:
<request>
    <method>GET</method>
    <endpoint>{url}/cursor/example?size=@{limit}</endpoint>
    <body/>
    <header>
        <item name="Authorization" type="string">{basic}</item>
        <item name="Content-Type" type="string">application/json</item>
    </header>
</request>
Response:
<body type="object" format="json" data="raw">
    <field name="items" type="array">
        <field name="id" type="string"/>
        <field name="name" type="string"/>
        <field name="username" type="string"/>
    </field>
    <field name="nextCursor" type="string"/>
    <field name="nextLink" type="string"/>
    <field name="forin" type="string"/>
</body>
Test-Run
The Test Run feature executes the configured connection, using the current editor state, directly from the Connection Editor and displays the corresponding runtime logs in real time. During execution, all API requests, loops, and responses are captured and displayed hierarchically in the UI. It is designed to support debugging, inspection, and optimization of interface workflows without relying on external log files or additional tools.
Functional Overview
The UI Logs provide a graphical representation of all runtime activities of a connection that can be accessed directly through the user interface. The UI log component provides structured, interactive access to runtime data, enabling developers to inspect requests, monitor performance, and identify issues directly in the editor.
UI Log Structure
The layout of the log viewer is inspired by browser developer tools and presents data in a structured, expandable tree view:
1. Connector and Process Hierarchy
Each connection is displayed as a hierarchical structure, representing the sequence of processes and operators. You can expand or collapse each level using the arrow icons.
2. HTTP Requests and Responses
- Each API call is shown with:
HTTP Method (e.g., POST, GET, DELETE, PUT)
Endpoint URL
HTTP Status Code (e.g., 200 OK, 201 Created, 204 Updated, 404 Not Found, 401 Unauthorized, 500 Internal Server Error)
Execution Time (in milliseconds)
Request / Response Headers — metadata such as Content-Type or Authorization
Request / Response Body (Payload) — the actual data sent and received
Header and body data can be copied to the clipboard using the copy icon ( ).
).
3. Loop Handling and Pagination
If a connection step contains a loop, its iterations are grouped together. The pagination control allows you to navigate between individual iterations (e.g., 2 / 12). You can also jump directly to a specific iteration by entering its index.
Navigate between loop iterations (pagination)
4. Error and Warning Indicators
Log entries are visually categorized by severity levels such as ERROR, WARNING, INFO. Click on an entry to expand it and inspect detailed request and response information.
5. Panel Controls
 Open log viewer in fullscreen mode
 Clear all log entries
- Copy headers, bodies or URLs to you clipboard
 Leave fullscreen mode
 Hide log viewer
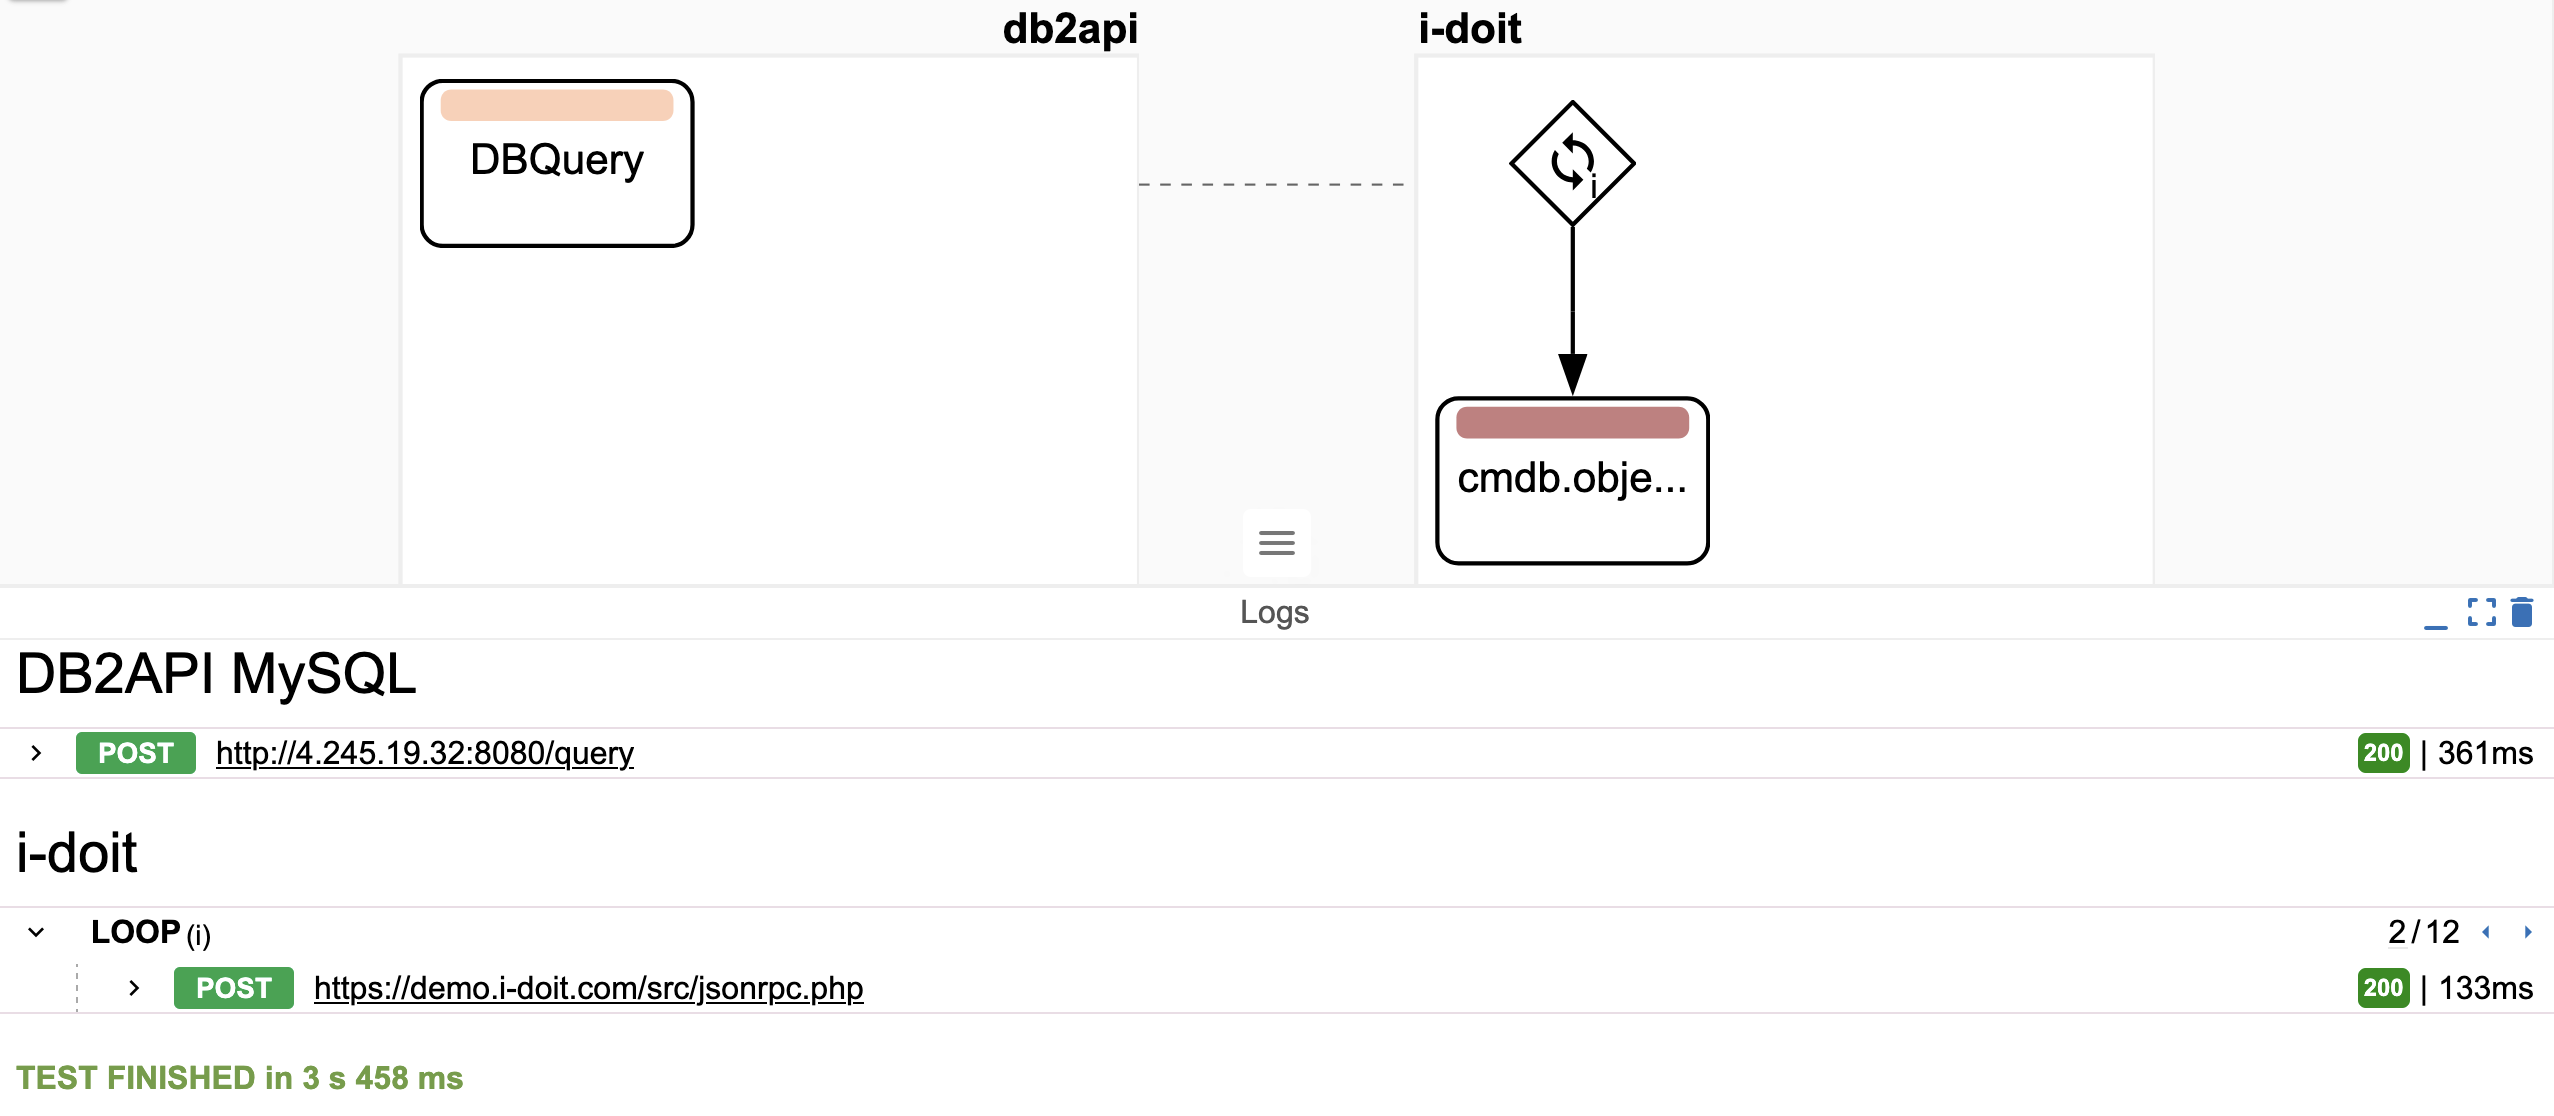
Presentation of the Connection Editor interface in the UI log
… and the unfolding of the API request
Real-Time Streaming (WebSocket)
Log data is streamed to the frontend via a WebSocket connection. This enables real-time feedback while a Test-Run is executing.
Technical details:
Bidirectional WebSocket channel between client and backend
JSON-based message format for all log events
Incremental streaming in chunks to reduce network load
Automatic reconnection logic on connection loss
Scalability and Performance
The log system is designed to handle large data volumes efficiently. Several mechanisms are implemented to maintain responsiveness:
Lazy-loading of log entries
Collapsed view for repeated or looped steps
Pagination when exceeding 500 log entries
Asynchronous rendering pipeline in the frontend
Scheduler Integration
The same logging system is also used for the Scheduler. This ensures a unified log format and viewing experience for both manual (Test-Run) and scheduled executions.
Consistent UI for live and historical executions
Logs accessible from the Scheduler job detail view
Full execution history with filtering by date, status, or job ID
Log Format
Each log event follows a defined JSON schema:
{
  "timestamp": "2025-10-27T10:45:32.521Z",
  "level": "INFO",
  "context": "connection.step.3",
  "message": "Request executed successfully",
  "duration_ms": 245,
  "request": {
    "method": "POST",
    "url": "https://api.example.com/items",
    "body": {}
  },
  "response": {
    "status": 200,
    "body": {}
  }
},
Error Handling
When errors occur (e.g., failed requests, timeouts, or invalid responses), the log entry is marked with level: ERROR. The UI highlights the affected request in red and allows developers to inspect the full request and response payloads.
Multi-Language Support for Enhancements
OpenCelium 4.6 introduces multi-language support for Enhancements, extending the enhancement execution engine beyond JavaScript. Developers can now write enhancement logic in Python 2, Python 3, and Ruby – with additional language support (e.g. Go, TypeScript) planned for future releases.
Overview
Enhancements in OpenCelium are used to manipulate or format data retrieved from API responses before passing it to subsequent requests. Previously, these logic transformations could only be implemented using JavaScript executed directly within the Core.
With the new multi-language feature, developers can define and execute enhancement scripts in different programming languages. This provides more flexibility for integrating existing code snippets or reusing domain-specific logic.
Architecture
JavaScript Enhancements Still executed directly in the OpenCelium Core runtime for minimal latency.
External Language Execution (Python / Ruby) Handled by a dedicated microservice — the polyglot-engine. This service runs code in a sandboxed environment to ensure security and isolation from the Core system.
Communication Enhancement scripts written in Python or Ruby are transmitted to the polyglot-engine, executed remotely, and their result is returned to the Core for further processing.
Repository: https://github.com/opencelium/polyglot-engine
Supported Languages
JavaScript (default; executed within Core)
Python 2
Python 3
Ruby
Example
JavaScript
let result = VAR_0.toUpperCase();
RESULT_VAR = result;
Python
result = VAR_0.upper()
RESULT_VAR = result
Ruby
result = VAR_0.upcase
RESULT_VAR = result
Configuration
The Polyglot Engine service must be reachable by the OpenCelium Core. Configuration is typically defined in the backend settings file (application.yml).
Example section (default setup):
###########################################################################
#                                                                         #
#   Polyglot Engine Configuration                                         #
#   You can enable Python 3, Ruby, or GraalVM JS                          #
#   using this configuration.                                             #
#                                                                         #
#   By default OC uses Nashorn JS                                         #
#                                                                         #
###########################################################################
polyglot:
  # Enables or disables the polyglot service integration.
  # Default: false
  enabled: false

  # Communication protocol used to connect to the polyglot service.
  # Supported: grpc (default), http (future)
  # Default: grpc
  protocol: grpc

  # Host address of the polyglot service.
  # Default: 127.0.0.1
  host: '127.0.0.1'

  # Port number of the polyglot service.
  # Default: 6566
  port: 6566

  # Automatically starts the polyglot service JAR if not running.
  # If false, assumes the service is already running externally.
  # Default: false
  auto-start: false

  launch:
    # Path to the polyglot service JAR file.
    # Required only if auto-start is true.
    # Example: /opt/polyglot/polyglot-service.jar
    jarPath:

    # Command-line arguments passed to the polyglot service.
    args:

    # Maximum time (in seconds) to wait for the service to start and respond.
    # Default: 30
    waitTimeoutSec: 30

    # JVM arguments used when launching the polyglot service.
    # Adjust for performance or memory tuning.
    # Default: "-Xms64m -Xmx256m"
    jvmArgs: '-Xms64m -Xmx256m'

    # Enables forwarding of logs produced by the external polyglot JAR
    # to this application’s logging system.
    # Default: false
    external-log-enabled: false
Runtime Behavior
When `polyglot.enabled` is false, enhancements are executed internally using the JavaScript engine.
When enabled, the Core routes enhancement scripts to the external Polyglot Engine.
Startup automation can be controlled via `auto-start` and launch.jarPath configuration values.
Logs and execution errors from the Polyglot Engine can optionally be forwarded to the main application log.
If the service is disabled or unreachable, enhancement execution will fall back to JavaScript-only mode.